It is hard to overstate the awesomeness of the bull market in semiconductors. Using the Philadelphia Stock Exchange Semiconductor Index (SOX Index) as proxy, the semiconductor industry has appreciated over 200% from the Covid low.
Unlike some other tech industries, semiconductors are a Capex heavy industry. During downturns, it tends to underperform dramatically, and conversely in upturns it outperforms dramatically. If we look at the performance of the SOX Index relative to the Nasdaq it outperformed in 1998 to 2001 during the dotcom bubble, and again from from 2012 onwards.
Finding a real world indicator of this not very hard. The biggest component stock of the SOX Index is TSMC. TSMC is the dominant foundry, and makes almost all the high end chips for companies such as Nvidia, AMD, Apple among others. TSMC is also an extraordinarily transparent company, allowing us to to track wafer shipments and average selling price (ASP). As can be seem below, somewhere around 2013, pricing inflected higher for TSMC, and the industry has been booming ever since.
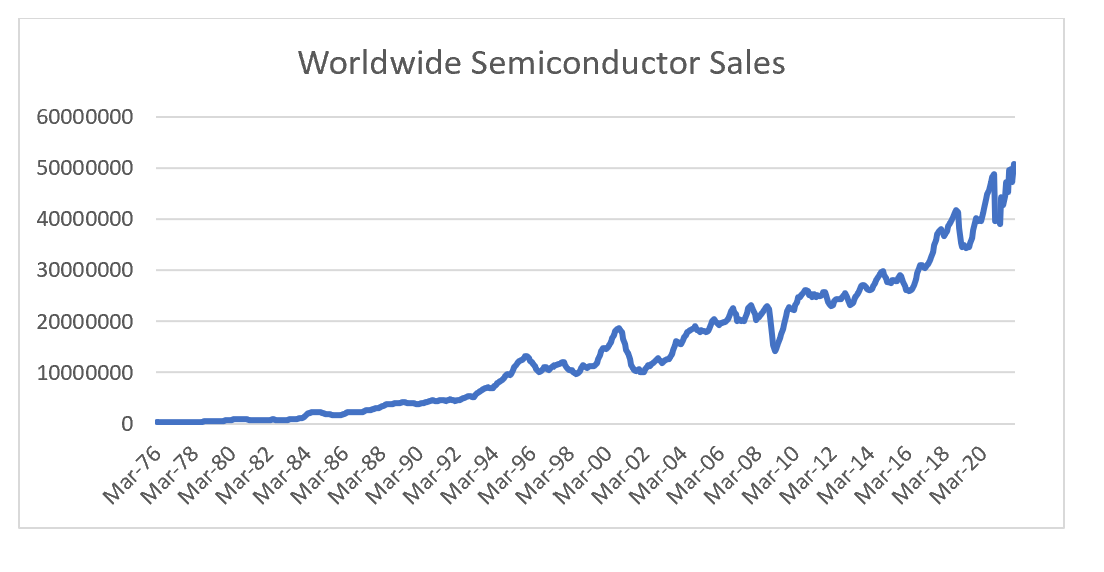
The improvement in pricing is evident in sales for the entire industry. Where we can see growth has inflected much higher in recent years, just as it did in the late 1990s. Data is taken form SIA.ORG and WSTS.
As a rule, per capita usage of semiconductor will rise going forward hence volume tends to always rise. The bigger issue is the pricing of semiconductors. When the dot com bubble burst, reducing demand for semiconductors just as a huge amount of capacity came online. If we look at the revenue of the two largest US semiconductor equipment makers, Applied Materials and Lam Research, we can see that there has been increasing orders for equipment, just as there was in 1999.
So if supply is coming on line, where could we see a drop off in demand? One area of demand for semiconductors has been cryptocurrency. When the profitability of mining bitcoin (or other cryptos) rise, this creates strong demand for high end equipment. Theoretically, the rise of cryptocurrencies changes the pricing dynamic of the semiconductor industry, meaning that the trend change in ASP seen above at TSMC is permanent, rather than temporary. While I have no view on the long term outlook on bitcoin, the rise in energy costs seen in 2021 and 2022, combined with recent weakness in bitcoin should reduce the profitability and demand for mining equipment. US electricity prices broadly follow the price of natural gas, which is beginning to break out.
Rising natural gas prices, should drive higher energy costs, which should drive tighter monetary policy. This should make life much more difficult for speculative assets such as crypto. If this was true we should see semiconductors begin to trade as an inverse to the oil and gas industry. We are beginning to see that.
The above chart suggest markets are beginning to price in the reduced investment into oil and gas industries, and the potential excess capacity in semiconductor industries.


