

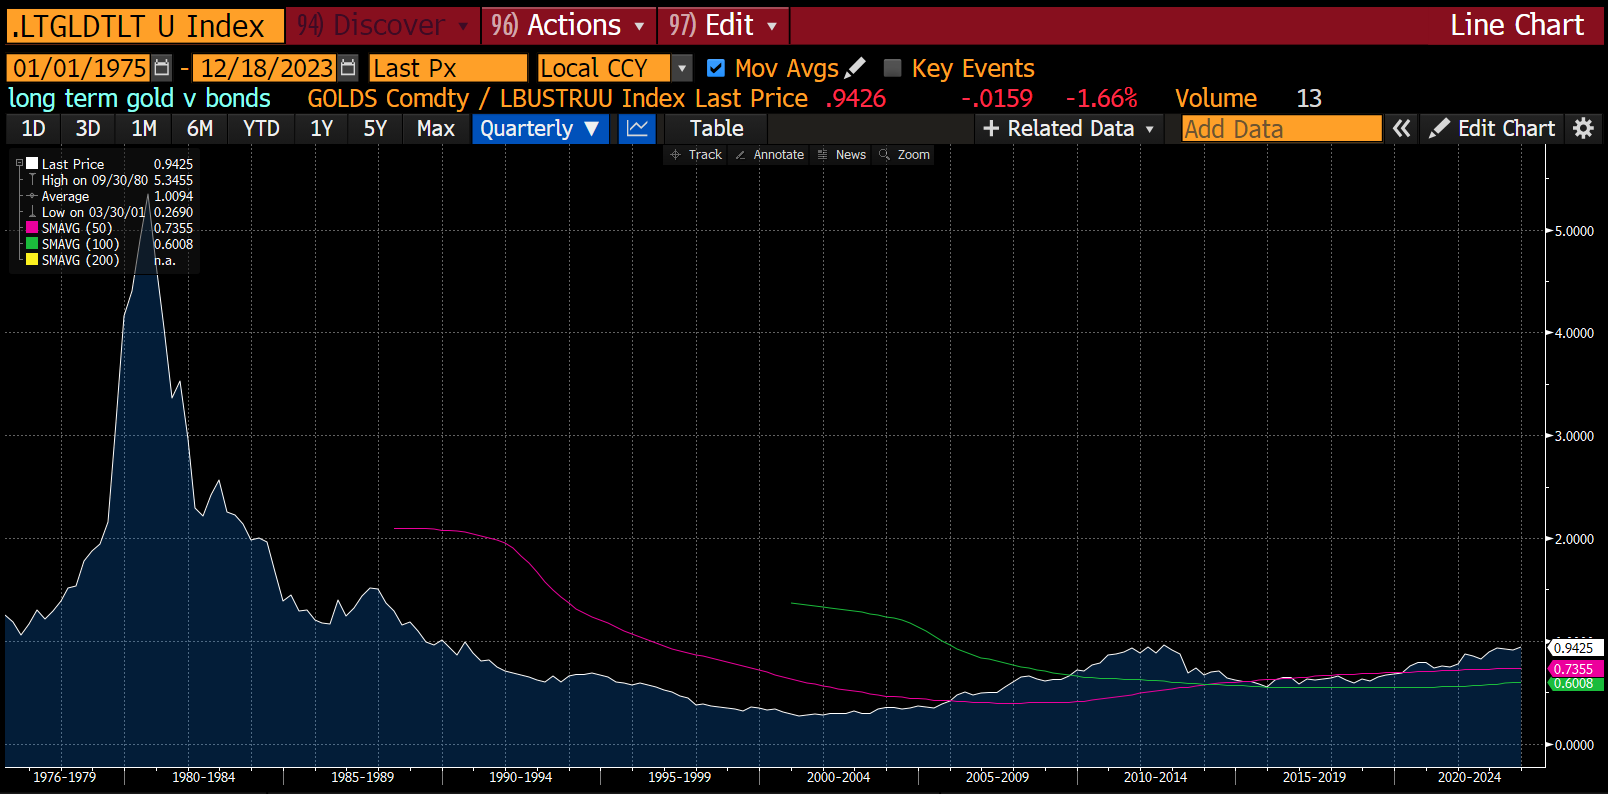
Year end is always a time of reflection for me. What have a I learnt, what do I think will do well next year. This is particularly true in 2023, as my main trade long GLD/short TLT wen from threatening to go parabolic in October, to reversing most of its gains in November and December.

I have suffered through many punishing reversals in markets. There is always a lesson to learn from these moves, the problem for most fund managers is whether they are willing to learn or not, or even if they are open to the idea of learning. Even though GLD/TLT traded well until October, I have been caught by surprise by how well liquidity driven assets like equities and even crypto have traded. I thought 5% Fed Fund rate would have starved the market of juice. You wanted to buy the Nasdaq 100 at the beginning of the year.

I was always keen on asset flows and capital markets (hence the title of the substack). I was very keen on the concept of NIIP, but this has been bearish on US assets since 2016, when private sector NIIP hit the same extreme as 2000.

As I licked my portfolio wounds this month, I paused to think about markets. “Macro” analysis and hedge funds work best in recessions. An old market saying is that recessions are about balance sheets, while bull markets are about profit and loss. What that is saying, in good times, you want earnings growth, and in bad times you want a solid balance sheet. Where macro analysis has gone wrong in my view is that we assume dodgy lending, awful balance sheets, plainly criminal CEOs and massive retail investment are all times of a top, and all these dodgy characters are about to get the just deserts. Even I thought about shorting private equity - and idea that many subscribers endorsed. A 45% rally from recent lows makes me happy I chose not to short it.

So what is the market trying to tell us about macro, central banks and US equity markets. So first some context, I talk about GLD/TLT as they are easily traded ETFs, but I am looking at a return to very long term graph of GLD/TLT. TLT is replaced with a long dated treasury return index. Plainly the 1970s was a very different time to the 1980s and 1990s, but bares some resemblance to 2000s, but 2010s where a return to 1980s and 1990s again. What connects all this disparate eras?
The simplest way, that makes most sense to me is that US politics and society is my its very nature designed to allow people to do whatever they want. The last thing any politician or central bank wants to do is to tell American to not do something. However, from 1970 onwards, oil and energy became a constraint on US growth and politics. The modern central bank and Federal Reserve would raise interest rates mainly to counter rising energy prices until something broke, and demand collapsed. However, these days, as far as energy is concerned, it is China that is constrained, and the US is unconstrained.

What does this mean for the US? Well if energy inflation is under control, then you should expect the Federal Reserve to be accommodating, and equities to do well. Looking at US Energy CPI, buying equities when this turns lower or flat seems to be work pretty well. Early 1980s onwards you wanted to be full invested. A tactical buyer late 2008, and a big buyer in 2016 and 2020 all makes sense to me. And once again, energy CPI has turned lower.

So GLD/TLT as trade collapses down to a view on commodity markets, and particularly the price of energy. So when Russia invaded Ukraine, I assumed we were in a era of high energy prices. But oddly enough, even European natural gas prices have collapsed.

When I look at the Biden administration, I see evidence of the pro-labour tilt that drives GLD/TLT. But if I look at the policy towards Venezuela, energy supply and low energy prices are just as important. Even the release of SPR oil points to a political elite that is very sensitive to the oil price.

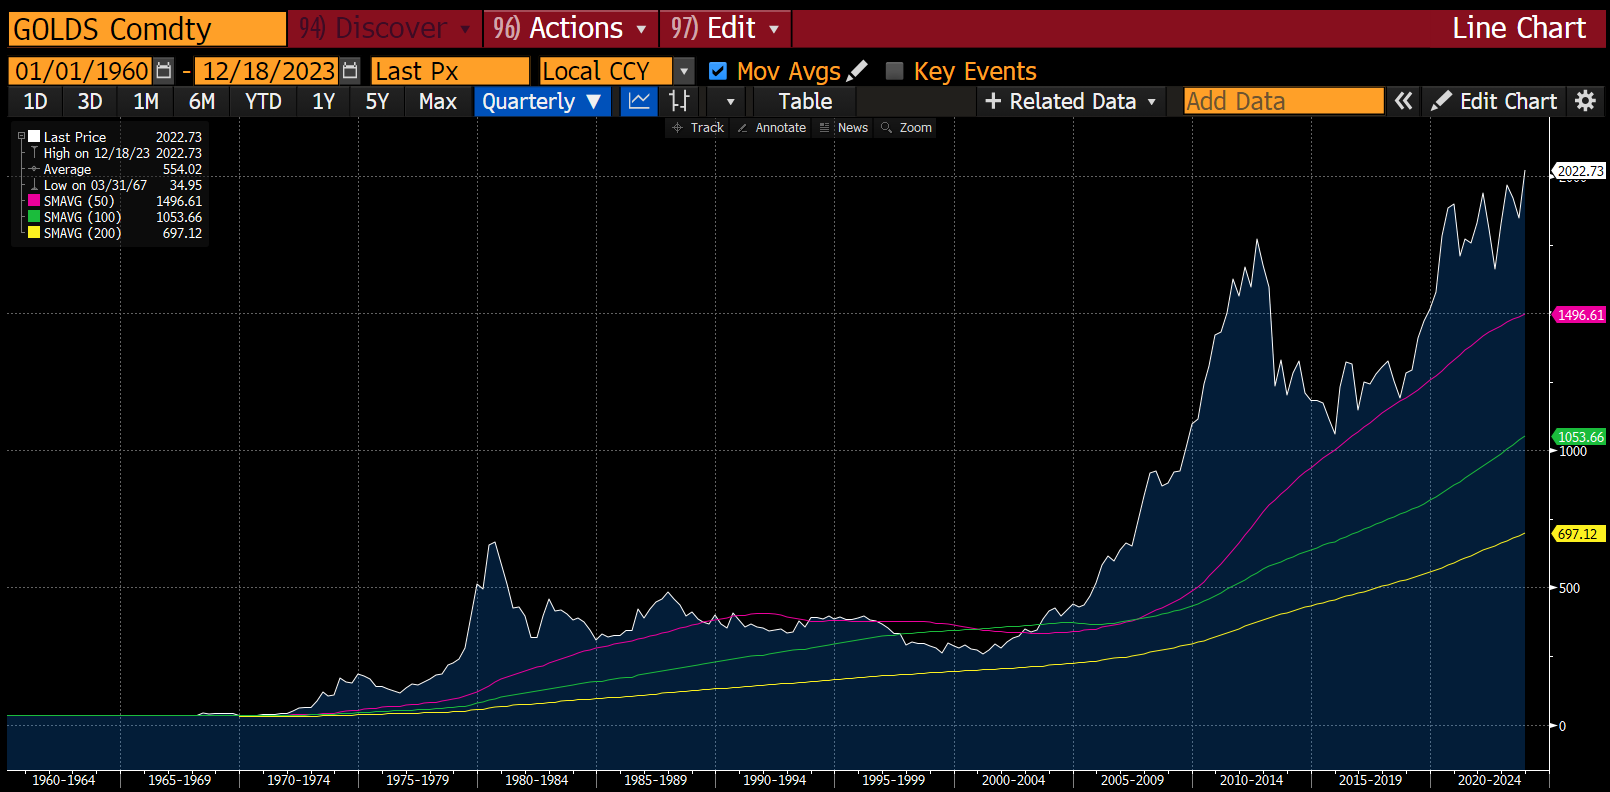
Coming back to GLD/TLT what does this all mean? Well as the oil import data above shows, a collapse in Chinese activity along the lines of the collapse of the Soviet Union or the Asian Financial Crisis would mean low energy prices for longer, and according to this analysis a strong equity market in the US. But with gold touching new highs this year, I think this unlikely. Gold picked up deflationary trends for commodities in 1980s and in the 2010s early on. A suddenly weaker gold price would imply long term energy oversupply I think.
The US oil industry continues to consolidate. At some point does market structure and incentive kick into see supply controlled and pricing discipline return. What I like about this analysis is that it explains why so many “macro” tools have proved useless in this bull market. The US will always want a bull market, except in oil prices. When energy prices are weak, US equities will do well, and when they are strong, there are problems. The GLD part of GLD/TLT suggest higher commodity prices will return.
