

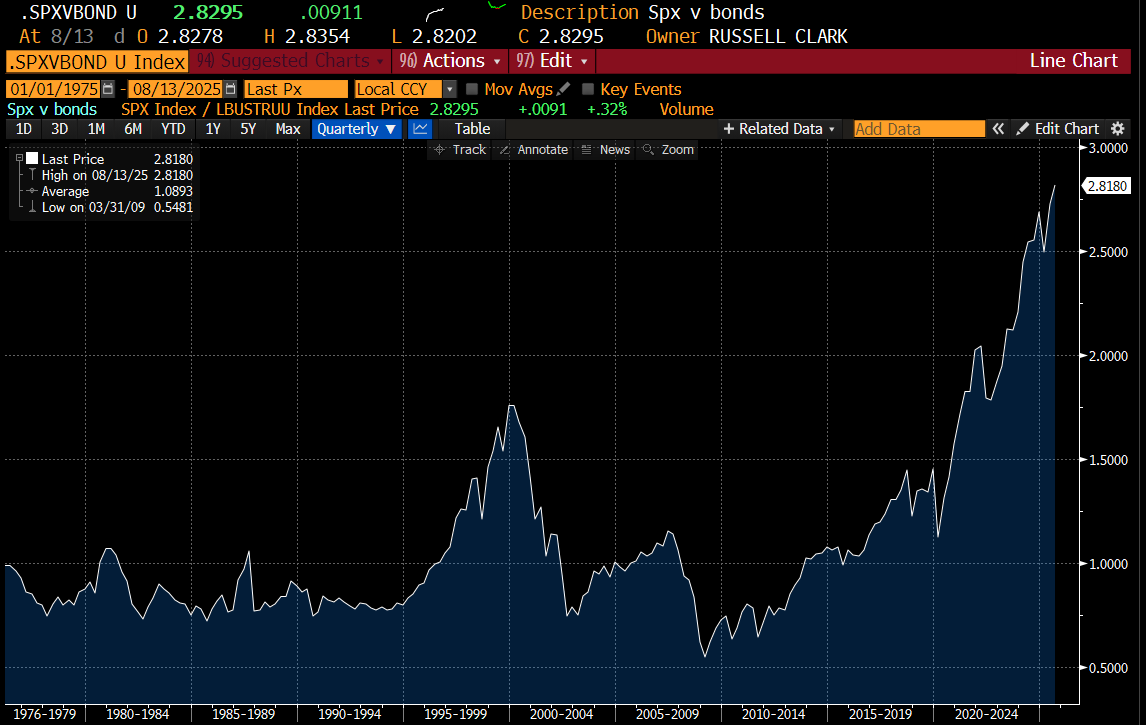
I have tended to be a “mean reversion” type of investor - thinking that boom is followed by bust. This has been the pattern in every market I had ever looked at, until this bull market in the US. I look at the returns of the S&P 500 relative to long term bond returns, it was mean reverting from 1975 to 2020 maybe? But since then, it has been unlike anything we have seen before.
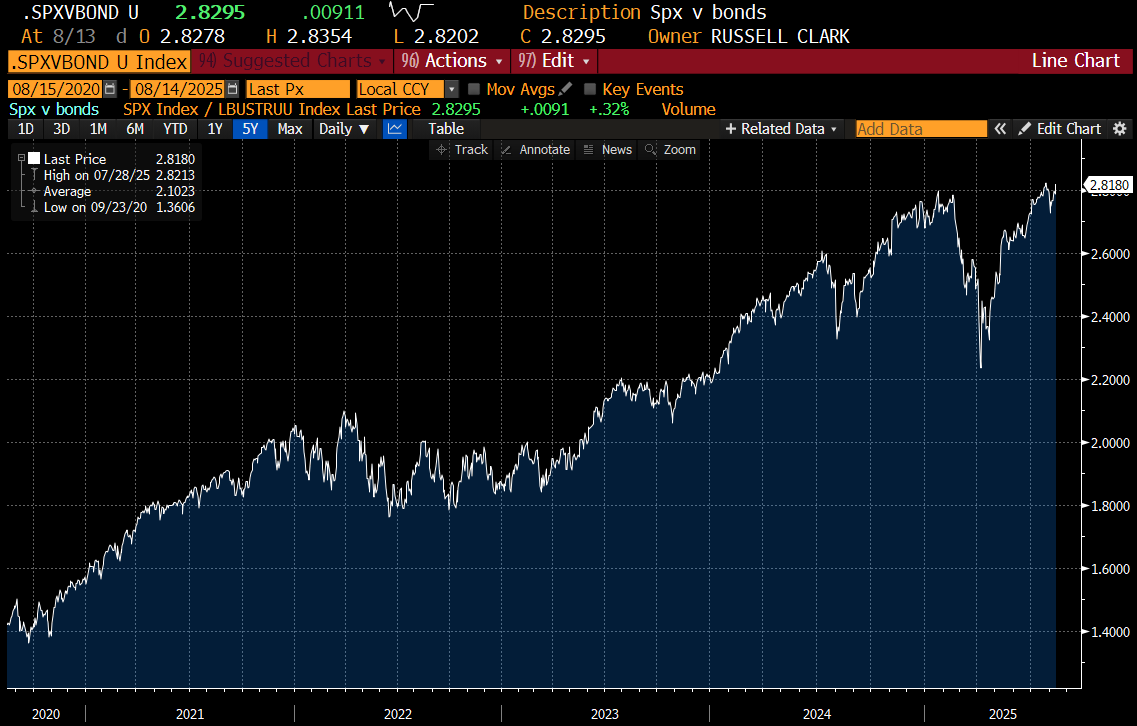
On a shorter time frame, the Freedom Day Tariffs hinted at a breakdown, but we have returned to highs.
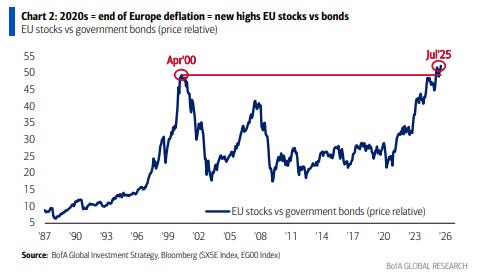
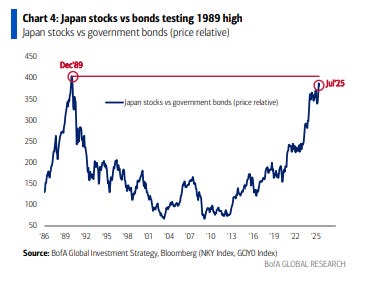
Interestingly BOA Hartnett has pointed out that Japanese and European equities have broken out versus bond returns as well. Even though Europe and Japan lack the tech exposure of the US, they are exhibiting the same relative move in equities versus bonds. Is this a top? Or are we moving to new paradigm?
The Japanese experience is very interesting. Japan went to deflation for nearly 30 years, but has now broken out it. Food prices are surging - but the BOJ is very reluctant to do anything about it.
I always wondered what the S&P 500 versus bonds would have looked like from 1900 to 1975. I assumed in the 1920s, equities outperformed bonds, and then bonds outperformed equities in the 1930s. From 1940 to 1965, I assumed equities outperformed bonds - but always wondered by how much. A recent article by the Economist provided very long term returns of bonds and equities - so gives us an idea (I tried to get Chat GPT to spit out the underlying numbers so I could present in the same format as above - but it was too hard for it to do).
From 1800 to 1900, bonds did better than equities - particularly when you adjust for risk (or volatility). As you would expect, equities outperformed bonds until 1920, and then equities underperformed bonds until around 1940. All are as you would expect, when you think about the financial world at that time.
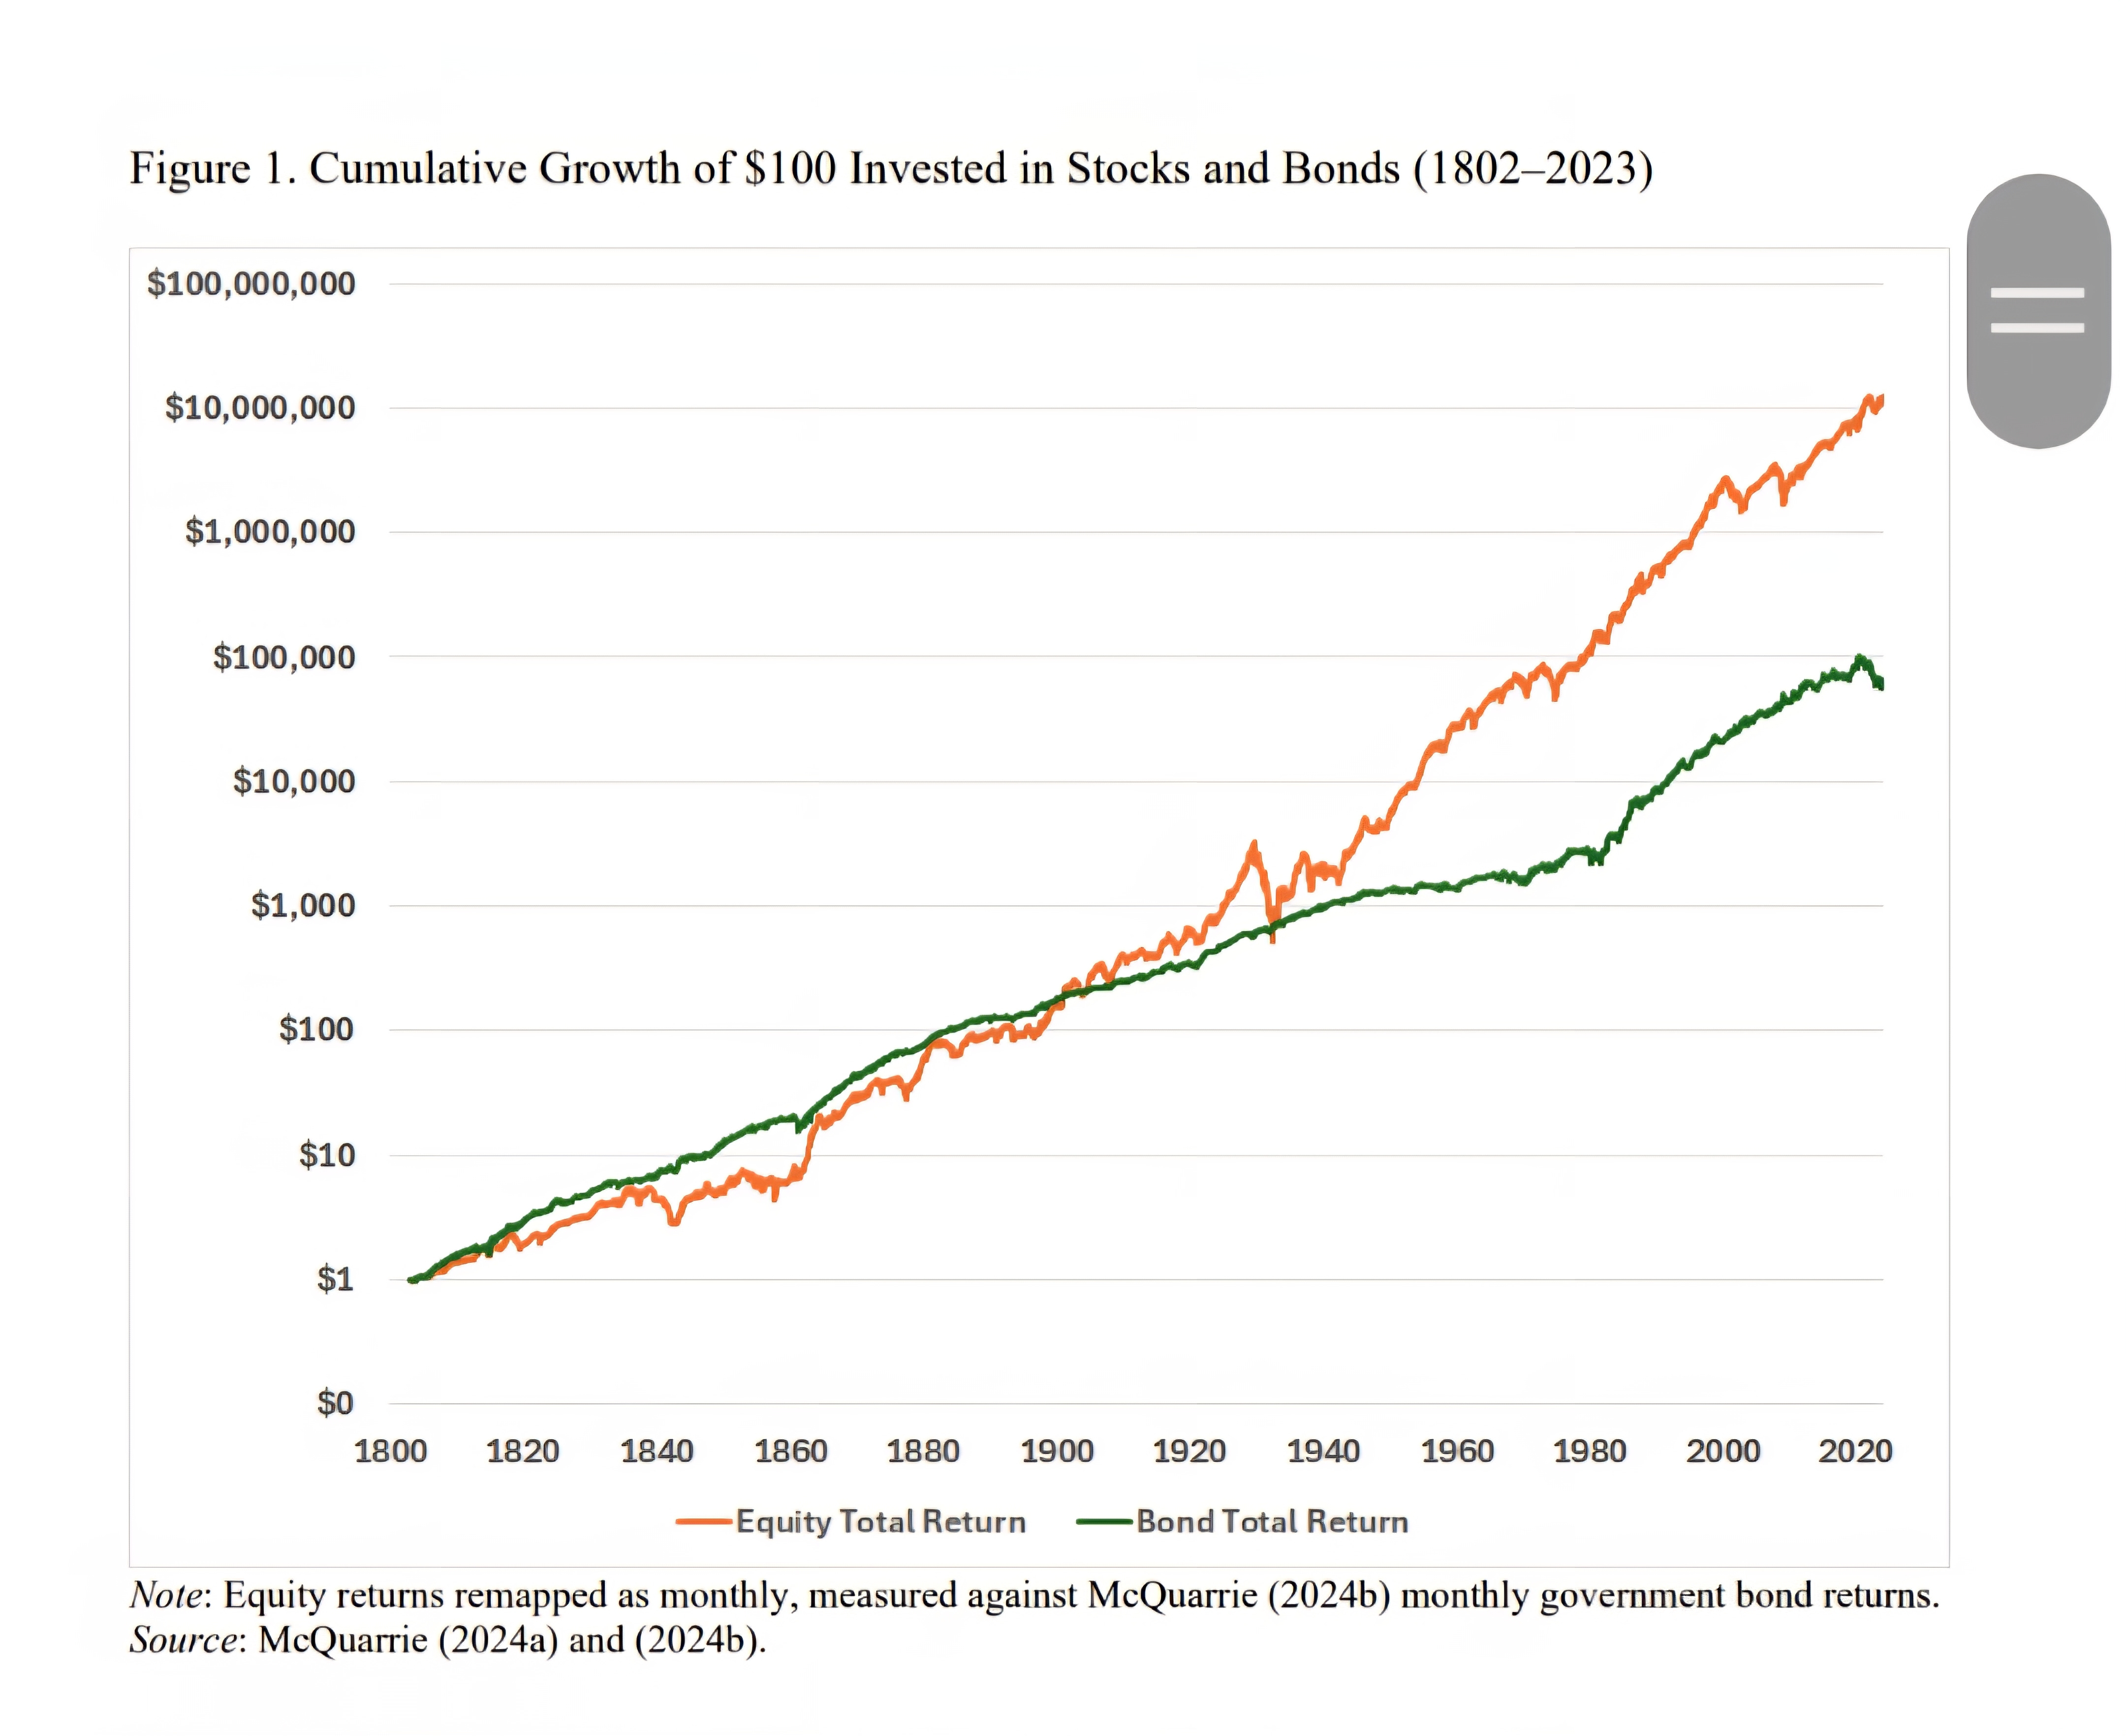
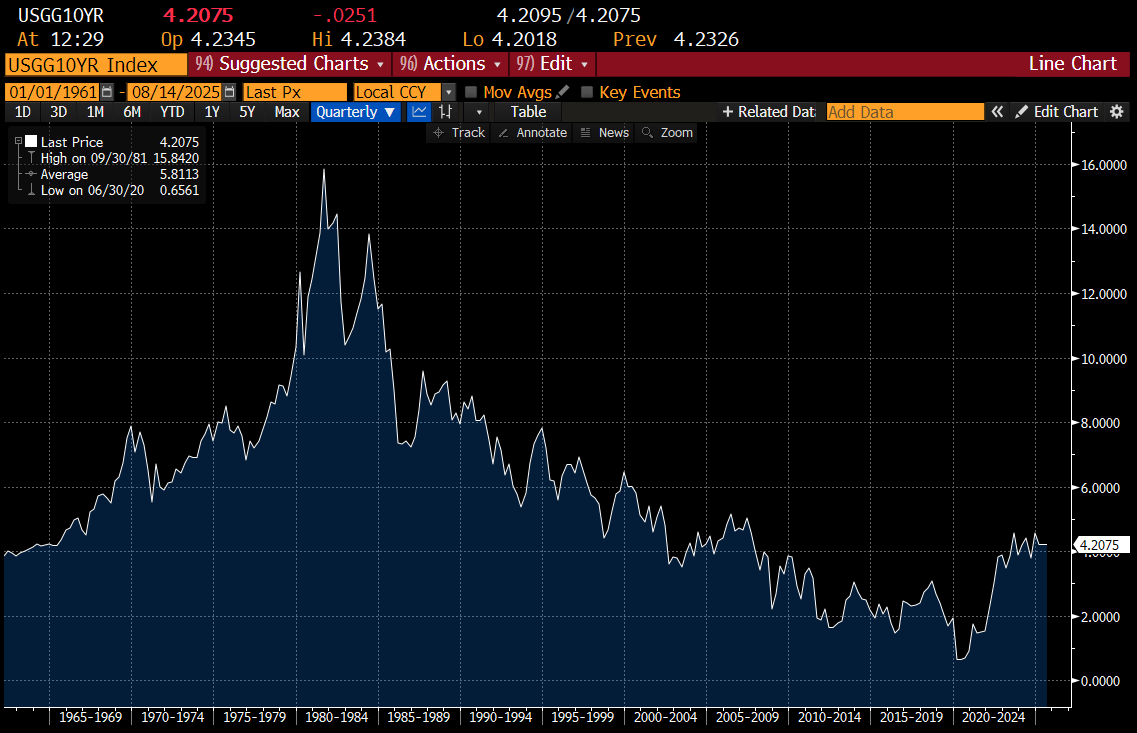
I think we are back in my “pro-labour” higher inflation era, when bonds do poorly. From 1940 to 1980, it shows almost no return to owning bonds. But over the same period, stocks were up hugely. How much is hard to tell, as it is log scale. It was only in the 1970s that we saw a return to bond outperformance, but after a long period of equity outperformance, and very high yields on treasuries - much higher than today.
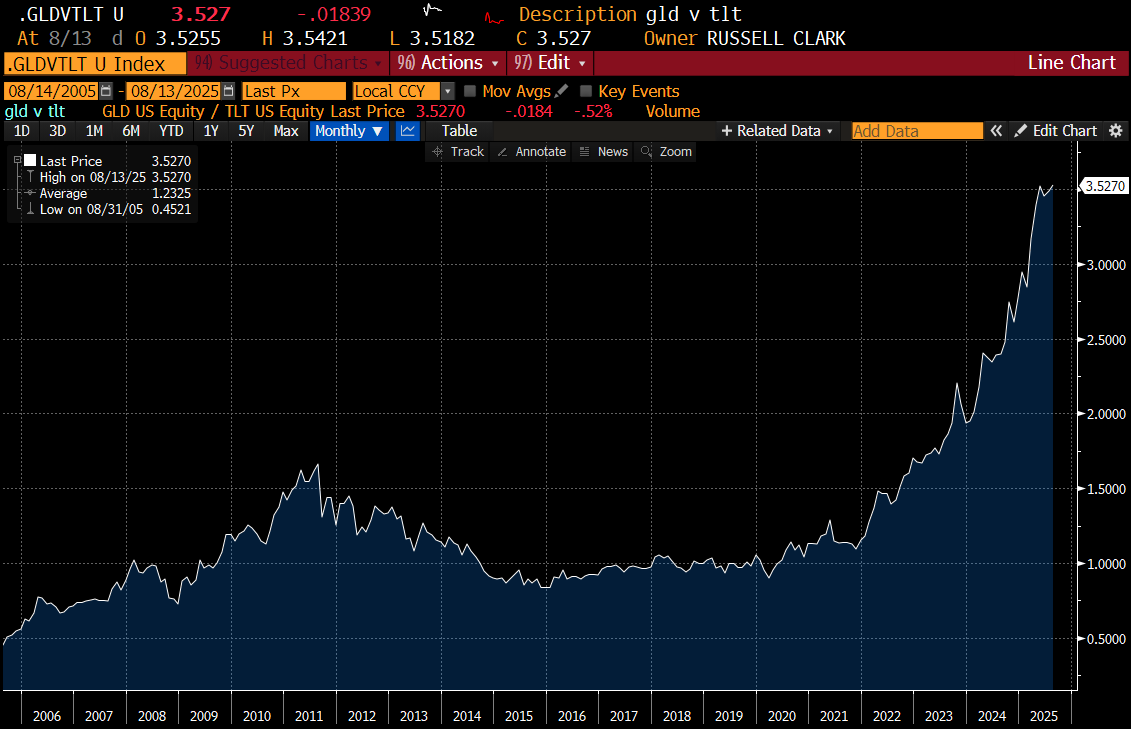
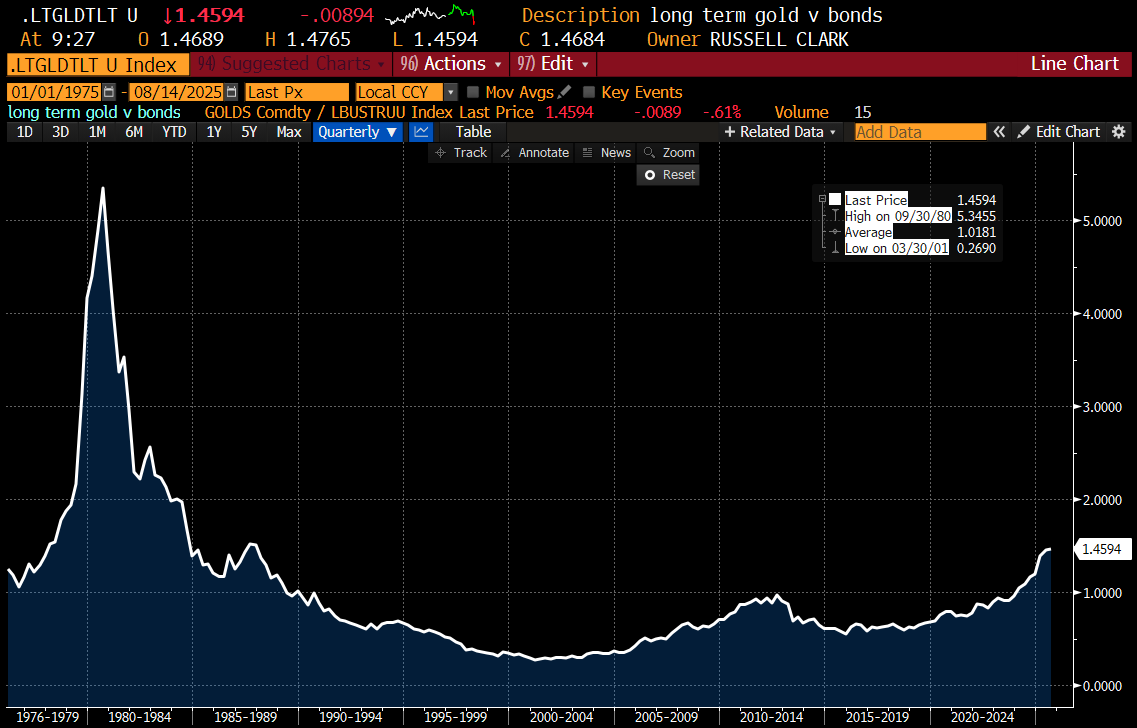
In some ways, the US is like any other country. Devaluing is a way to default on debt - and it naturally makes investors move out of nominal assets into real assets. Gold versus treasuries reflect the same issue. When you feel the US policy is inflationary, then gold does better than treasuries. Gold almost acts a protest vote on US policy.
The above charts seem to suggest the performance of bonds has been the most extraordinary bubble from 1980 to 2020, which is now reversing. US bonds used to be backed by gold. Gold prices were contained until 1970, when it was set free. If gold is “real” money, does it not make more sense to compare gold to the S&P 500? That is treasuries are always likely to deliver negative real returns in pro labour periods, so we need to use a “real asset” that is like money to make a comparison.
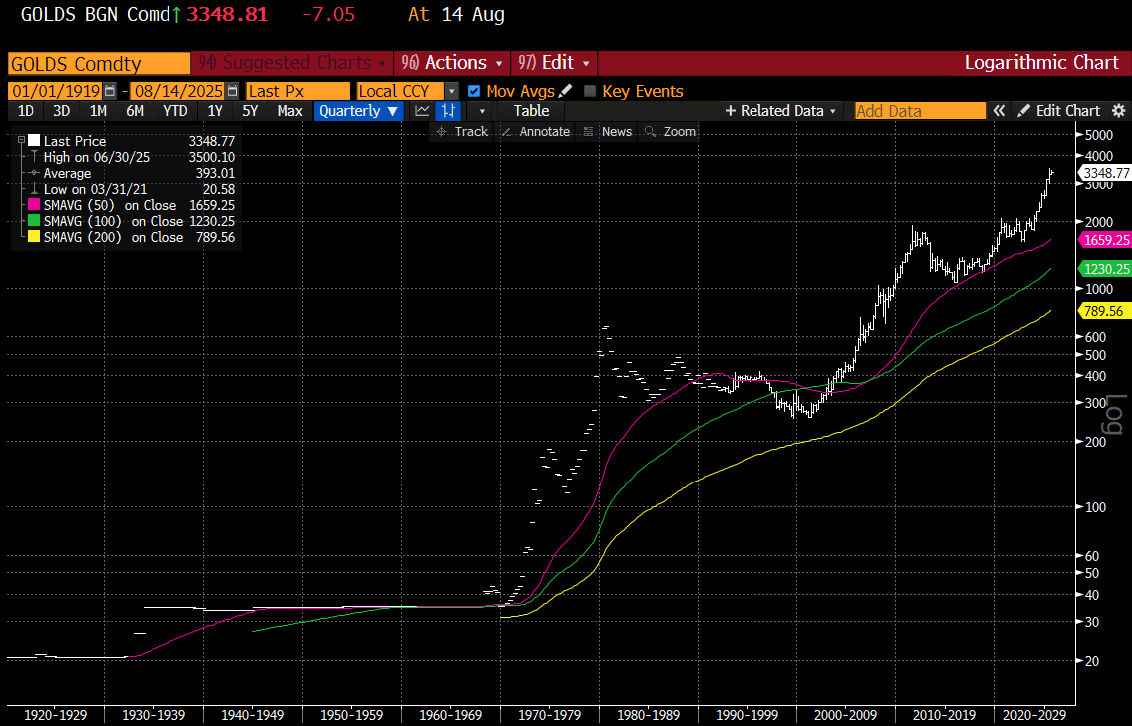
So a better analysis of post world War II financial history is that the US took advantage of its low borrowing costs to engineer a boom, delivering negative returns to owners of treasuries. At some point, foreigners got frustrated with US policy, and preferred gold to treasuries. This lead to a political change in 1980s, which was much more bond friendly, what I call a “pro-capital era”. The question then, are we in the 1940s to 1960s era, or are we in the 1970s era? I assumed that the break out in gold vs treasuries we have seen the last few year meant we were closer to the 1970s era.