

This week’s Economist has a leader, criticising America’s new drug-pricing rules. I knew this was going to be a subpar article when the first line is “A quirk of American law long barred Medicare, the public-health insurer for the elderly, from negotiating with drug firms over prices.” To describe this as a quirk is a stretch. It is almost certainly the product of lobbying buy US drug companies, and at odds with the VA prescription system, also state funded, which is allowed to negotiate drug prices on behalf of its members.
Back in 2017, I published a note on the US healthcare system, explaining how exactly Medicare had come to be abused by many of the drug companies now complaining. I republish it now, as I am working on updating it, and having the old note on the website will be helpful, when I finish the update. I generally don’t like reposts, but this one is useful.
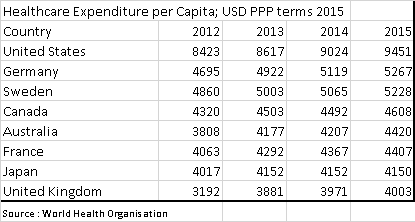
The US Healthcare system is truly extraordinary. Per capita spending on healthcare is double the levels seen in most other developed countries. This is in part driven by a very different set up. Key differences are the private sector has far more freedom to market drugs directly to consumers, and Medicare, the largest buyer of drugs, is prohibited by law from negotiating lower prices. The result is that the US has higher prices for drugs, and due to the extra spend, also has the most innovative drug market. It can be argued that the US subsidises drug development for the rest of the world. However, recent increases in drug prices seem to have been driven by regulatory changes due to the Affordable Care Act (Obamacare), rather than market forces.
In 2016, total US health expenditures were USD 3.3 trillion. US citizens directly paid (out of pocket) for USD 350bn, with the remainder paid by third parties. USD 1.1 trillion was paid for by private health insurance, with Medicare and Medicaid paying USD 1.2 trillion. Finally, USD528 billion was met by a mixture of other government programs, privately raised funds and charities.
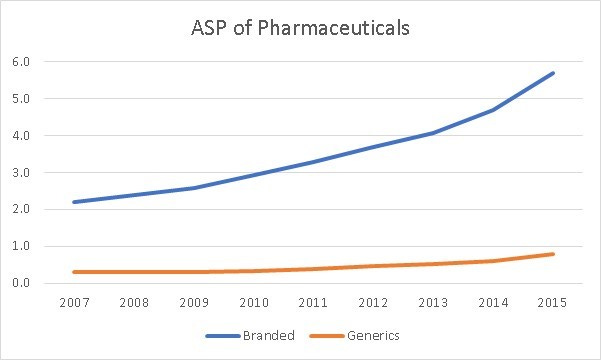
Of the total USD 3.3 trillion spent on healthcare, USD600 bn was spent on drugs, with half on prescription drugs. The other half was spent on drugs used in procedures, and not procured via a prescription. While drug spending has doubled since 2007, we have seen a steady increase in the use of generics at the expense of branded drugs.
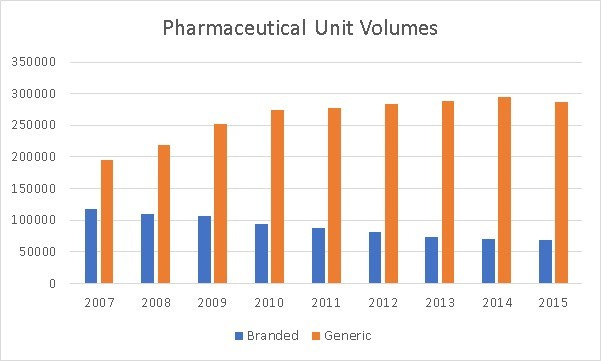
However, even as we have seen volumes decline for branded drugs, we have seen an increase in total spend for branded drugs.
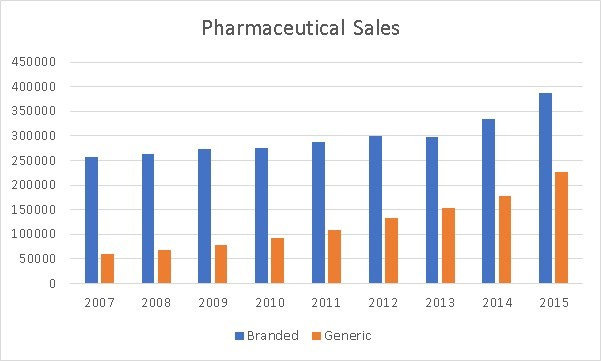
Generic drug spend has also increased significantly in the last few years. Both generic and branded drugs have seen price increases.
The above graphs, would imply that all prescription drugs, both branded and generics have seen price increases. However when we consult data from independent US advisory agency, MEDpac and from the Centre of Medicare and Medicaid Studies (CMS) a different picture appears.
MEDpac looks at Medicare Part D (the part of Medicare that pays for prescription drugs) data from 2009 to 2014. The most striking feature is how the average price for a prescription for a low cost beneficiary has fallen by 24% over the period, while the average drug cost for high cost beneficiaries has risen by 50% over the same period.

One of the reasons for the increase in high cost beneficiaries has been the development of a new drugs that cure hepatitis C. The main drugs used here are Solvadi and Harvoni, and according to data from CMS, total Medicare spending on these drugs in 2014 was 3.8bn USD from nothing in 2009. Total high cost spending without the hepatitis C drugs would have still risen to 60.8bn USD, or a doubling of spending on high cost drugs compared to a 27% rise on low cost drugs. Excluding the hepatitis drugs, we can see that drug spend rose 14% for Medicare in 2015 from 2014, while it rose 25% for Medicaid over the same period. Given that volumes have been flat, and we have excluded the big increase from hepatitis C drugs, the growth in spending has been driven by drug prices.
Drug cost increases at Medicare and Medicaid have been driven by long standing issues, that were exacerbated by the changes brought about by Obamacare. Government run pharmaceutical plans such as Medicare and Medicaid are banned from negotiating drug prices with manufacturers. This is at odds with other government run healthcare programs such as the UK’s NHS, which use their buying power to drive prices down.
There are two big drivers to recent drug increases in my view. There has been changes in how Medicare pays for drugs, creating an incentive for drug companies to raise prices. The second has been the increase in the number of orphan drugs being developed, which has put upward pressure on drug prices. Both factors now look to be coming under regulatory pressure.
For Medicare Part D spending, high cost beneficiaries are defined as those beneficiaries who spend over USD6154 a year on drugs. Spending in excess of USD6154 is 95% covered by Medicare. However spending from USD2700 to USD6154 is not covered at all by Medicare. Spending from USD 295 to 2700 is 75% covered by Medicare, while the first USD 295 is not covered at all by Medicare. The gap from USD 2700 to USD 6154 is known as the Medicare Donut Hole. Changes under Affordable Care Act, allowed for some drugs to be purchased at a 50% discount to list price, while the full list price could be counted towards Medicare Donut Hole. Below graph shows the out of pocket spending for a given level of drug spending.
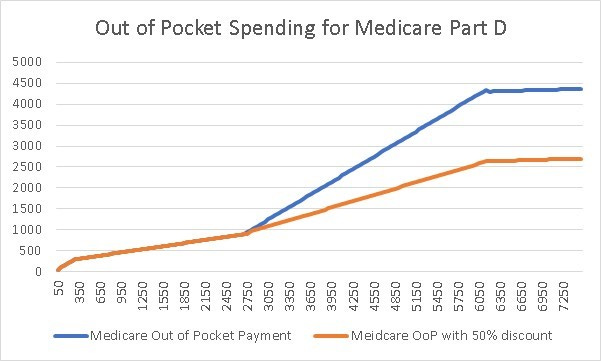
For drugs with little or no competition, prices could be raised without effecting demand, as the drug consumer would potentially see marginal prices fall dramatically if this pushed them in to the top tier of Medicare benefits where costs are 95% covered. This can be most clearly seen in the graph below where out of pocket spending on drugs fell even as health insurance spending on drugs rose. According to the Medicare (a federally run health program for the old) drug spending dashboard, 29 of the 70 drugs details saw 50% price increase over 5 years. Medicaid (state run health program that targets the poor) saw ever larger number of drugs with big price increases.

The FDA is starting to take aim at rising drug prices, particular older drugs that have recently seen drug prices increase by speeding up the approval of generic drugs https://www.fda.gov/newsevents/newsroom/pressannouncements/ucm564725.htm
This has a detrimental effect on the share prices of generic drug makers, as increasing competition is being priced in.

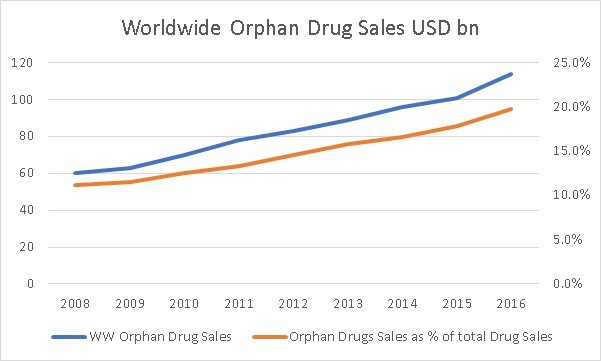
Orphan drugs, are drugs that are designed for conditions with relatively small numbers of sufferers. In the US this is defined as having less than 200,000 potential patients. If orphan drug status is granted by the FDA, then 7 years marketing exclusivity is given as well as 50% tax credit on R&D, plus other grants. The rising share of orphan drugs has also been a big driver of higher costs. According to the EvaluatePharma Orphan Drug report 2017, the average cost per patient of orphan drugs is USD 140,000 vs USD 28,000 for non-orphan drugs. The same report notes that orphan drug sales now make up nearly 20% of all drugs sales worldwide, up from 11% in 2008.
There is an issue with the Orphan Drug Act, as highlighted by this blog post from the relatively new head of the FDA, Scott Gottlieb. See here. (Note Scott Gottlieb stepped down as FDA head in April 2019) The post states that Orphan Drug status has been granted for many paediatric treatments. There were pre-existing laws that were intended to stimulate paediatric drug studies. However, the use of paediatric sub-groups to gain orphan status has actually led to less paediatric studies. This would imply that the FDA is looking to greatly tighten up the issuance of Orphan Drug status. Orphan Drug status has conveyed great benefits on the pharmaceutical industry. Firstly, it allows drugs to be tested on smaller populations, greatly reducing costs. Secondly, it has allowed some drugs to be granted orphan drug status, but then go on to be used for treatment of much wider patient population. Thirdly, some large pharmaceutical companies have sought and received orphan drug status for the some of the best-selling drugs in the world. These highly profitable drugs, then received favourable tax credits and exclusivity on marketing in this area for 7 years. The Kaiser Health Network found that about a third of orphan drug approvals have either been repurposed for all users or have received multiple orphan drug status to market so different subsets of patients.
Rising drug costs have been one cause of rising insurance premiums in the US, which have risen faster than income and inflation over the last 10 years. The new head of the FDA is looking to foster competition to reverse these effects, and his efforts have already lead to weakness in generic pharmaceutical companies. Investors should exercise caution with branded pharmaceutical companies.
