


One of the factors that was identified as a cause of the Japanese bubble economy was the intercompany dealings of Japanese conglomerates - keiretsu (系列). Broadly speaking, they were groups of companies, often centred around banks, that helped each other out, and often had cross shareholdings in each other. Korean chaebol (재벌) are very similar. Keiretsu banks often lent to other keiretsu members at favourable rates. There was also a great deal of cross shareholder ownership, which protected control, and reduced the amount of capital needed in these businesses. When the Plaza accord led the Yen to soar, BOJ stimulated to offset the deflationary pressures and the banks soared. The Topix Bank index rose 700% from 1984 to 1989.

After the bubble economy burst, the cross shareholding structure came under severe criticism, and with the failure of many banks, the core keiretsu structure was problematic. Banks came under pressure to sell their shareholdings into the market. Japan’s biggest bank, Mitsubishi UFJ Group, is still selling down its holdings even today. All the big banks have similar experience, and the slide below gives an idea of the scale of selling.

This put Japanese banks in a difficult situation. For MUFG, the value of these other assets (cross shareholdings) were greater than the equity in the bank. In 2002, MUFG has 9 trillion of Yen in equity holdings compared to 3 trillion of equity. Banks were better considered leveraged Nikkei ETFs than banks. By being forced sellers of equities, this created downward pressure on prices, which would create pressure on the balance sheet, in a vicious circle.

This balance sheet weakness then lead banks to issue shares to boost equity. From 2002 to 2010, the share count at MUFG grew more than 300%.

The idea behind forcing banks to sell equity holdings was to allow third parties to come in and encourage free market pricing and behaviour. While good idea in practice, the BOJ became impatient with equity weakness. In 2013, the BOJ became big buyers of ETFs linked to the Nikkei and Topix. Current BOJ assets are put at 37 trillion (on a cost basis). MUFG - largest bank in Japan has peak equity assets of 9 trillion. It seems that the BOJ has basically replaced the commercial banks as key shareholders of Japan Inc.

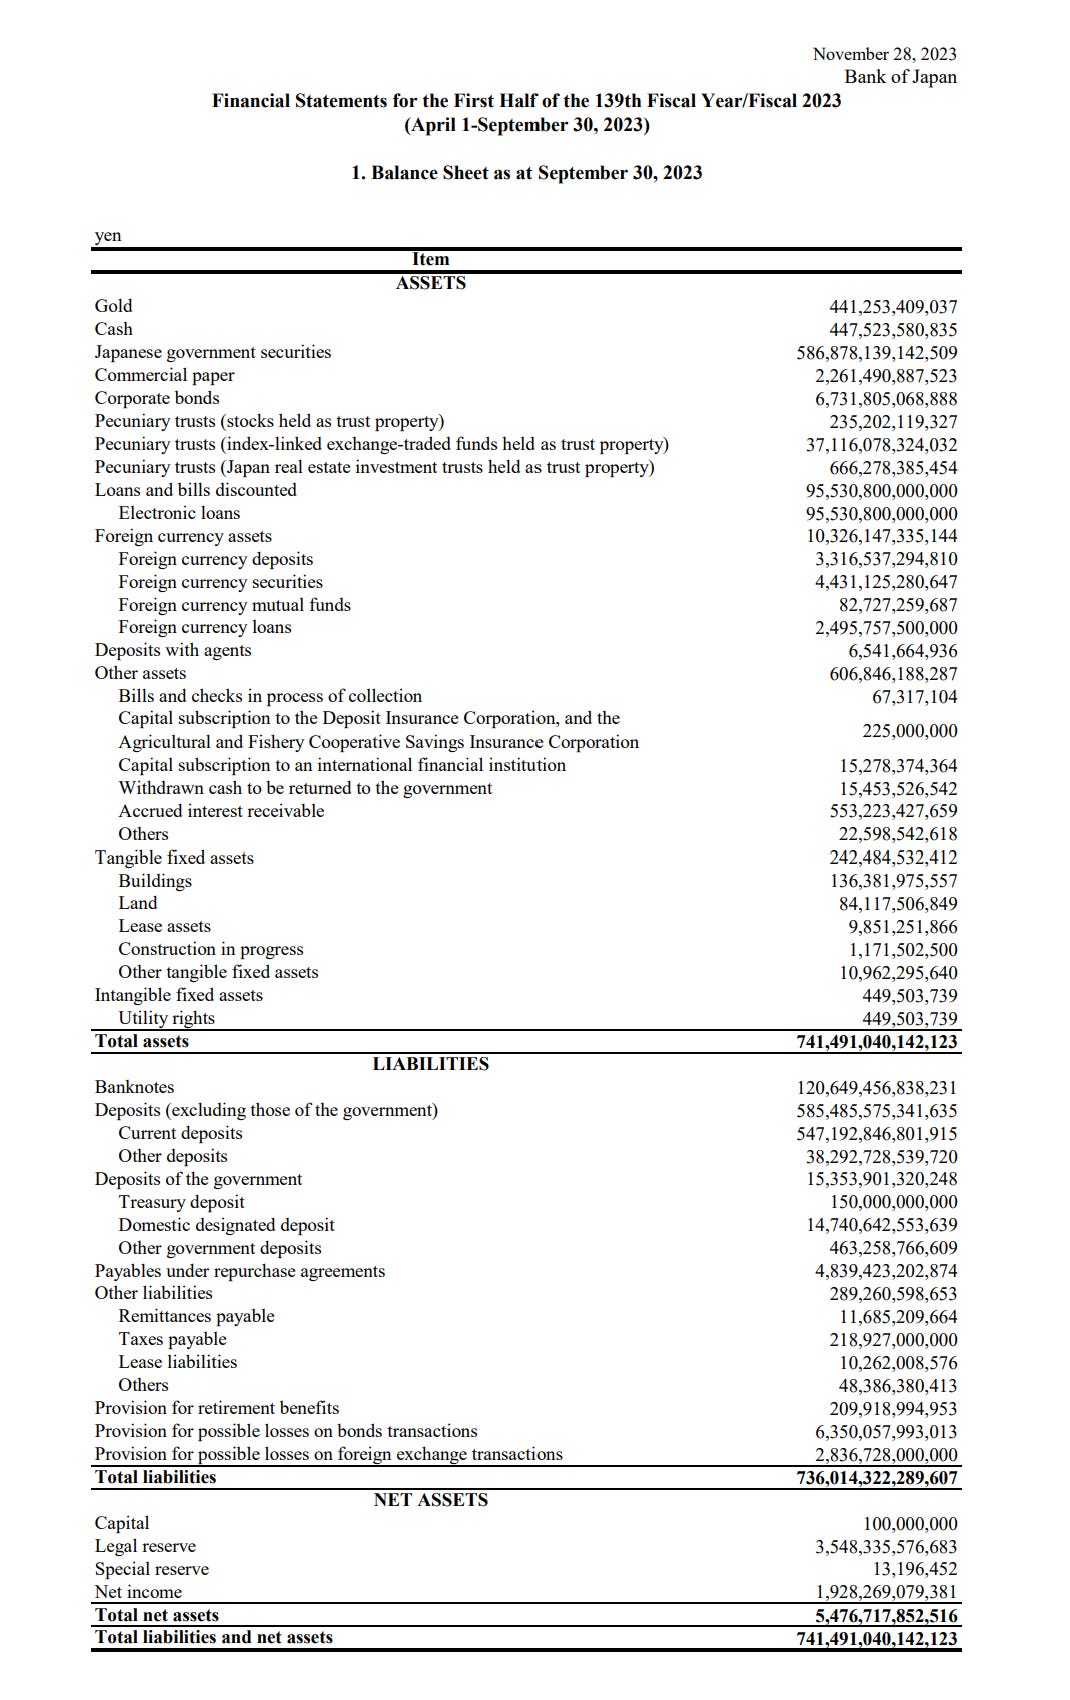
So the BOJ has managed to soak up the unwinding of the cross shareholdings by becoming a large holder of Japanese equities. This seems to somewhat defeat the purpose. It has also transferred leverage from the private sector to the public sector. The BOJ balance sheet shows assets of 741 trillion yen supported by equity of 5 trillion yen.
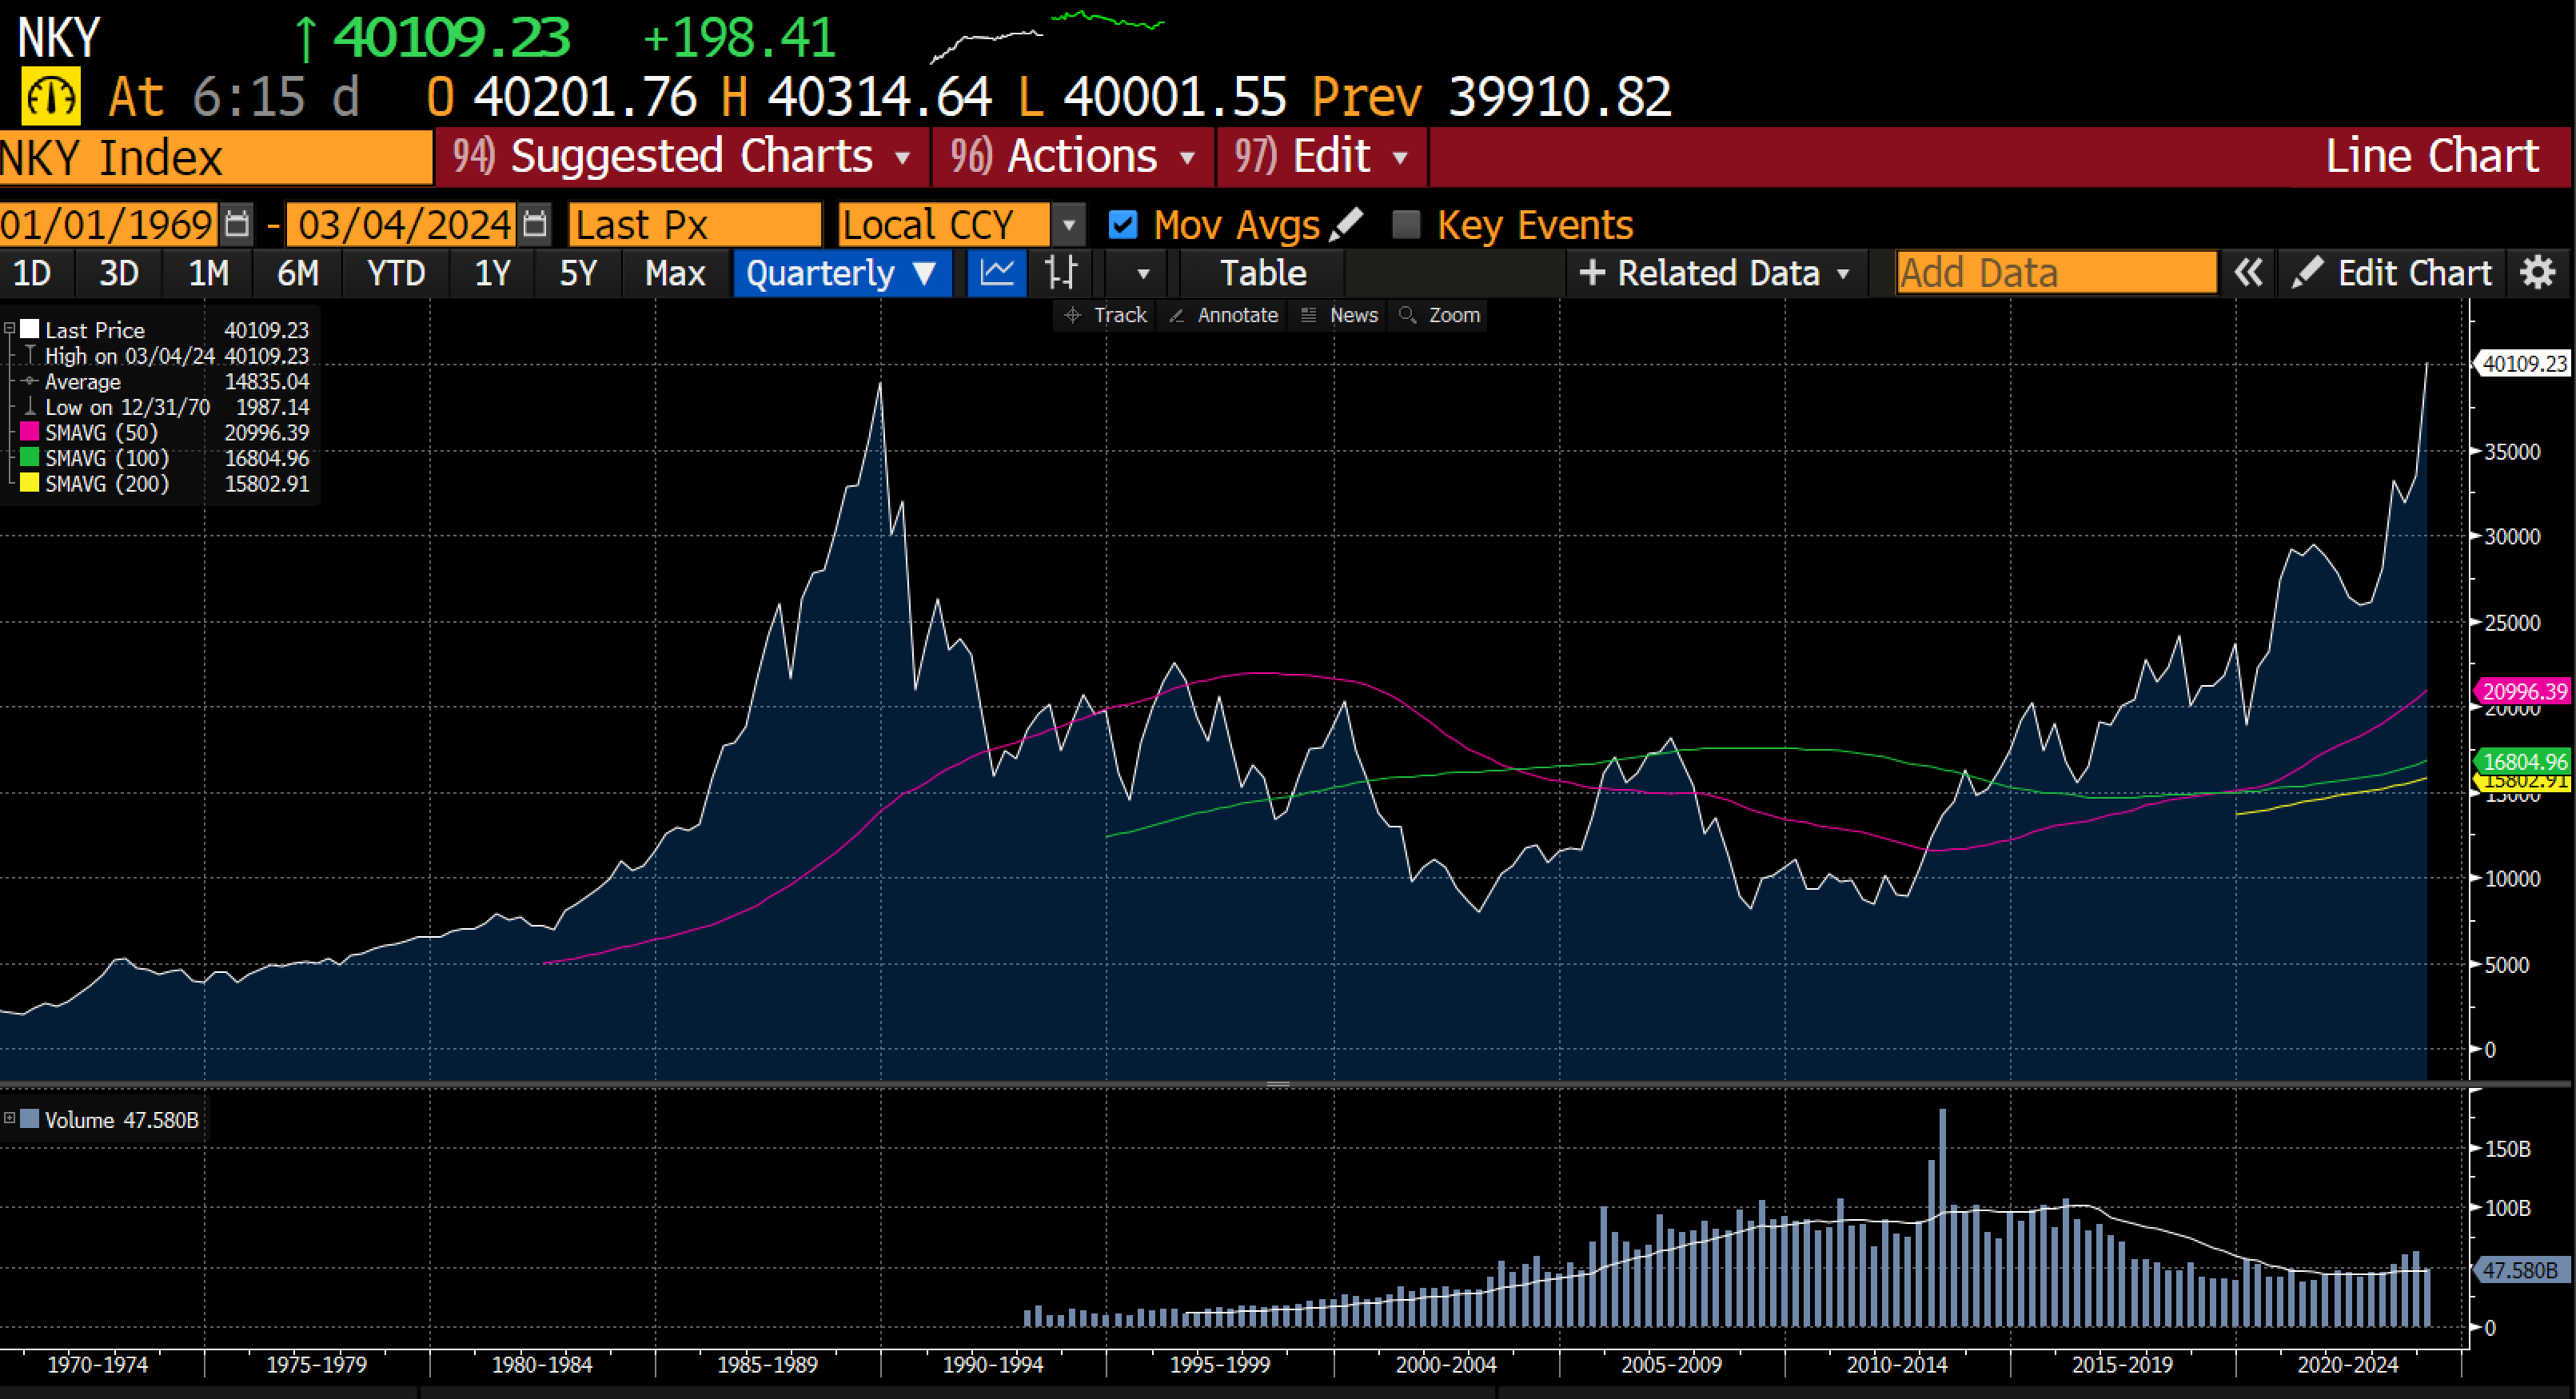
Of course, this has had the very pleasing outcome of allowing the Nikkei to take out its all time high set in 1989.
It has also had the pleasing effect of separating the idea of growing production from asset values. Japan industrial production remains well below peaks.

Likewise, nominal GDP and GDP per capita have become divorced from the stock market.

The BOJ has also managed to create one of the most extraordinary charts in finance. The old BOJ that defended living standards and the currency was able to get gold in Yen in 2000 back to levels seen in the early 1970s. The new BOJ has managed to get gold to skyrocket in Yen terms.

The BOJ policy is trying to recreate the “magic” of the bubble economy. The problem is that is only affecting assets prices, and is not leading to rising wages, or rising industrial output. How much more public wealth needs to be transferred to private hands?
