

When Ben Bernanke and the other central bankers started talking about QE after the GFC - I really wondered why they thought it was a good idea. The long experience of Japan showed that it did nothing for creating inflation, and in my mind made things worse. My understanding of boom and busts in a free market capitalist world was that capital flows would create a boom, and then its reversal a bust. Looking at Japan, we can see the how flows in the 1980s, followed by either contraction or stagnation. All data taken from BIS locational banking statistics - A3.1 9 (here).

The stagnation of Japan was a real outlier in the 1990s and 2000s, as the rest of the world went on a credit boom. But from 2007 onward, global flows have taken on a very Japanese flavour.

The US BIS data share a passing resemblance to Japanese data in the aftermath of its bust. A rapid rise in claims and liabilities, that then leads to a long period of stagnation.

Is there a way to forecast when the growth of liabilities and claims could end? In my view, liabilities and claims should move together, and when they become unbalanced, there was a risk of a market shock. Both Japan and the US have multinational corporates that muddy the BIS data, but BIS data does suggest both are at extremes in terms of claims over liabilities. Ireland shows more clearly how extreme capital flows can be caught in BIS data.
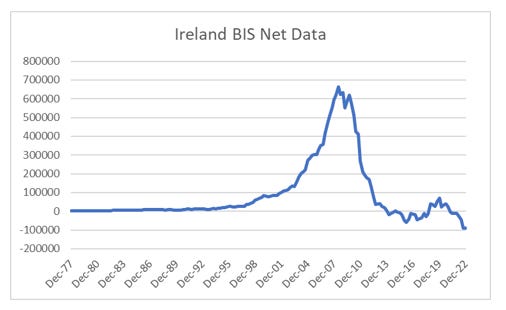
You can see that both Japan in late 1990s, and the US in 2007, claims and liabilities moved apart before coming the crisis. If I was looking at the current net positions of Japan and US, I would say that imbalances have built out again, and a deflationary period beckons again. That is long TLT and short GLD would be the trade.

What about China? As you would expect financial flows boomed post GFC, and from 2014 onwards fears of Chinese devaluation of deflationary bust have stalked the market.
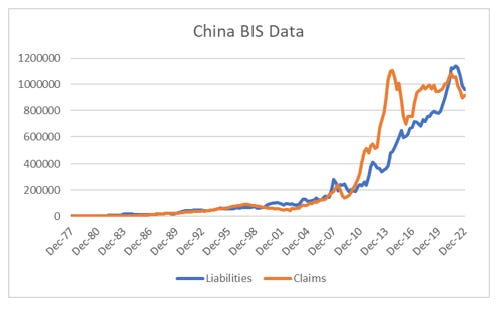
Using BIS net data, China has the same extremes between claims and liabilities that we saw before Ireland, Japan and US deflationary busts, but China has managed to defuse that bust without either devaluing or seeing a collapse in asset prices. This for me is the game changer in inflation terms.

So one way that the extreme net positioning we see in Japan and US could play out, is the same way it has played out in Korea. South Korea has had three extremes in Net BIS Data, 1997, 2007 and today.

All three periods have been market by currency weakness.

So what does it all mean? China has balanced its BIS position, while Korea, Japan and the US have extreme net positions. The most likely outcome is that the Chinese Yuan will likely strengthen, which will be gold positive and treasury negative. Long GLD, short TLT still looks like the right trade.
