


Peak Oil Price
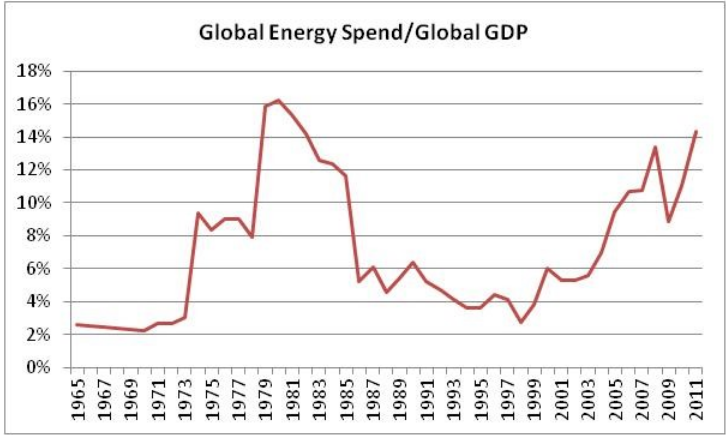
From $10 per barrel in 1999, crude oil has been in bull market with the brief exception of the financial crisis in 2008/9. So much so, that the recent rise in Brent oil to $119 per barrel barely generates a mention in the financial press. However, the reality is that the current spend on energy is similar to the level of spending seen during the second oil shock in the late 70s (see chart below). At that time, in a decade, oil went from $2 per barrel in 1970 to $35 in 1980 before falling gradually back to $10 over the next twenty years.
To try and adjust for the emergence of China, I have looked at its energy spend as percentage of GDP and then compared it to both Japan and South Korea. As can be seen in the chart below, China is currently tremendously inefficient in its usage of energy. Japan has always been far more efficient in its use of energy to produce GDP than either of its neighbours. While China has spent more energy as percentage of GDP, this was in the 1970s when the Chinese economy was imploding.
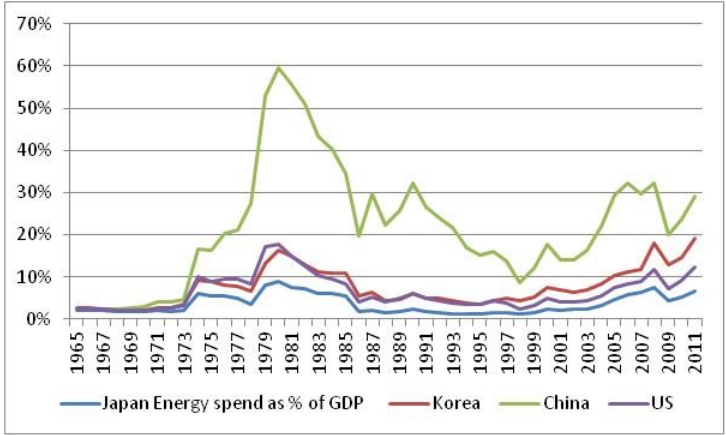
Of course one of the big differences is that China has huge domestic resources of coal which allows it to be inefficient with its energy. However, even then it still compares badly with the US. Recent US numbers are also overstated as I use the Brent price rather than WTI, and ignore lower cost of natural gas in the US.
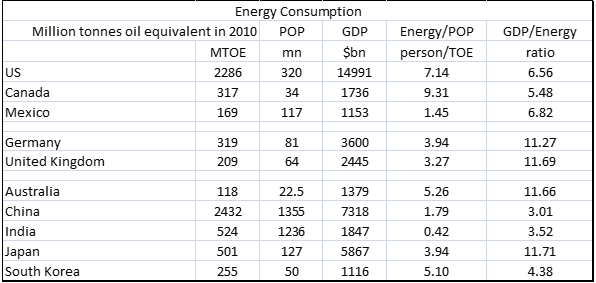
China already consumes more energy that the US, even though its GDP is half that of the US. I like to look at energy usage in terms of per capita and also in terms of how much energy is needed to produce a dollar of GDP. As seen below, China is around half the per capita level of Japan, UK and Germany. Given that Chinese energy consumption has more than doubled over the last ten years, this implies a slowdown in consumption growth going forward in my mind. Or in other terms, the base level of consumption has increased so much that the Chinese growth rate must begin to slow. Regarding GDP produced per unit of energy, China is around 25% less efficient as Germany, UK, and Japan, and half as efficient as the US. Again, efficiency gains should reduce the growth rate of Chinese energy consumption going forward.
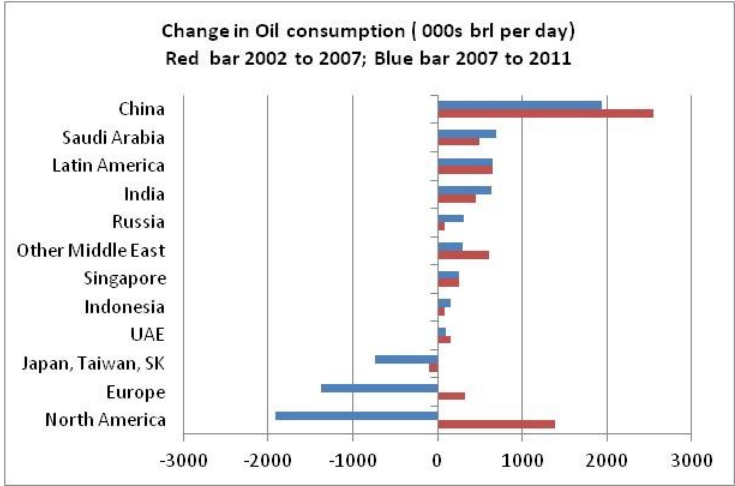
One of the reasons I scrutinise Chinese energy demand, is that oil demand has become increasingly dependent on China. If you look at the chart below, you can see that in the five years to 2007, oil demand grew in most regions. However, since 2007 China has continued to grow while the US, Europe and developed Asia have reduced consumption. Furthermore, other areas that are growing demand for oil also tend to be oil exporters, hence their demand for oil tends to move with the oil price rather than increase at lower oil prices. Hence the drivers for oil are becoming increasingly narrow.
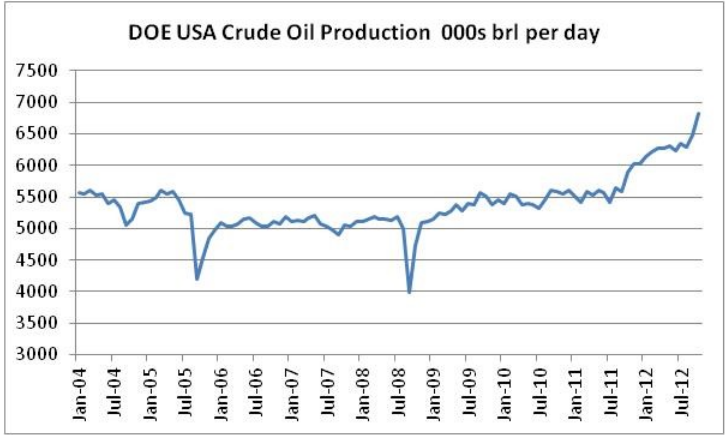
While demand growth is increasingly reliant on Chinese demand, supply is also beginning to respond to higher prices. As can be seen below US oil production is surging.
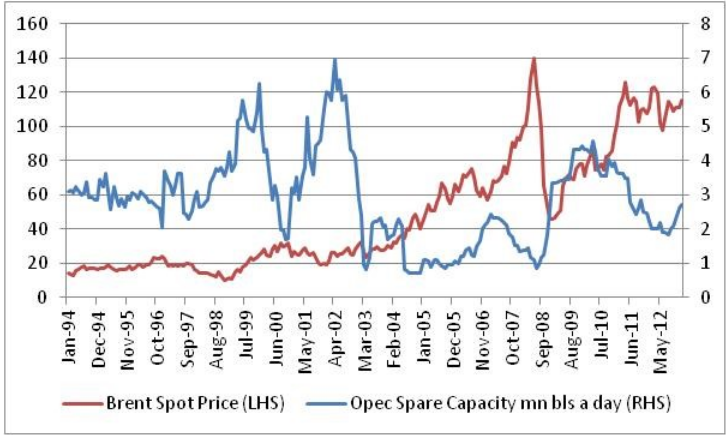
We are seeing signs that increasing oil production and slower demand growth from the western world is starting to cause spare capacity at OPEC producing nations to rise. Historically this has occasionally preceded a fall in the oil price.
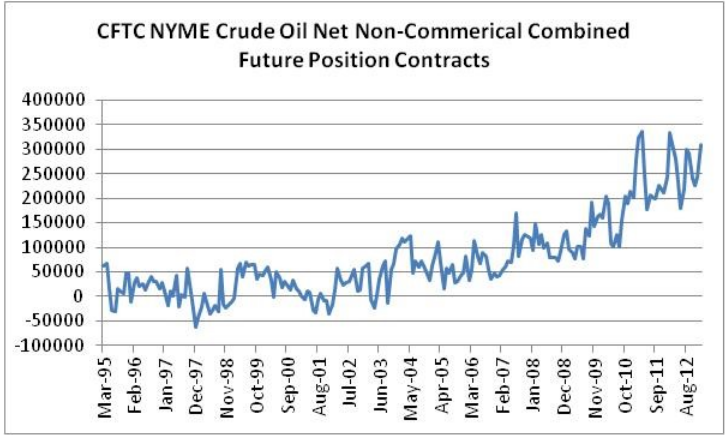
What is also surprising about the oil market is that speculative investors no longer seem willing to bet on lower oil prices. In the late 90s speculative investors were often willing to take a net short position in the oil market – but particularly since 2007 the market seems to have become structurally long. This may reflect the rise of passive investors in the commodity market via ETFs, or possibly the effect of zero interest rates making speculation cost free. I suspect a combination of these two reasons explains the long bias of investors in oil.
The sustained rise in oil prices has also led to a huge surge in government spending in oil producing nations, with Russia in particular needing $100 per barrel to balance its budgets. Some analysts take this to imply that oil now has a floor at 100 USD a barrel. I think this is unlikely. Far more likely is that if and when oil prices begin to fall, either through slower Chinese growth or higher interest rates, we are likely to see large currency devaluations from oil producing nations in order to balance their budgets. The most recent example of this is Venezuela, which just devalued by 47% in a single day. When I see record inflows in to emerging market bonds funds, which in my view, are the most exposed assets to this type of devaluation, I feel compelled to be short areas that I believe will fall in value when the oil price begins to fall.


