


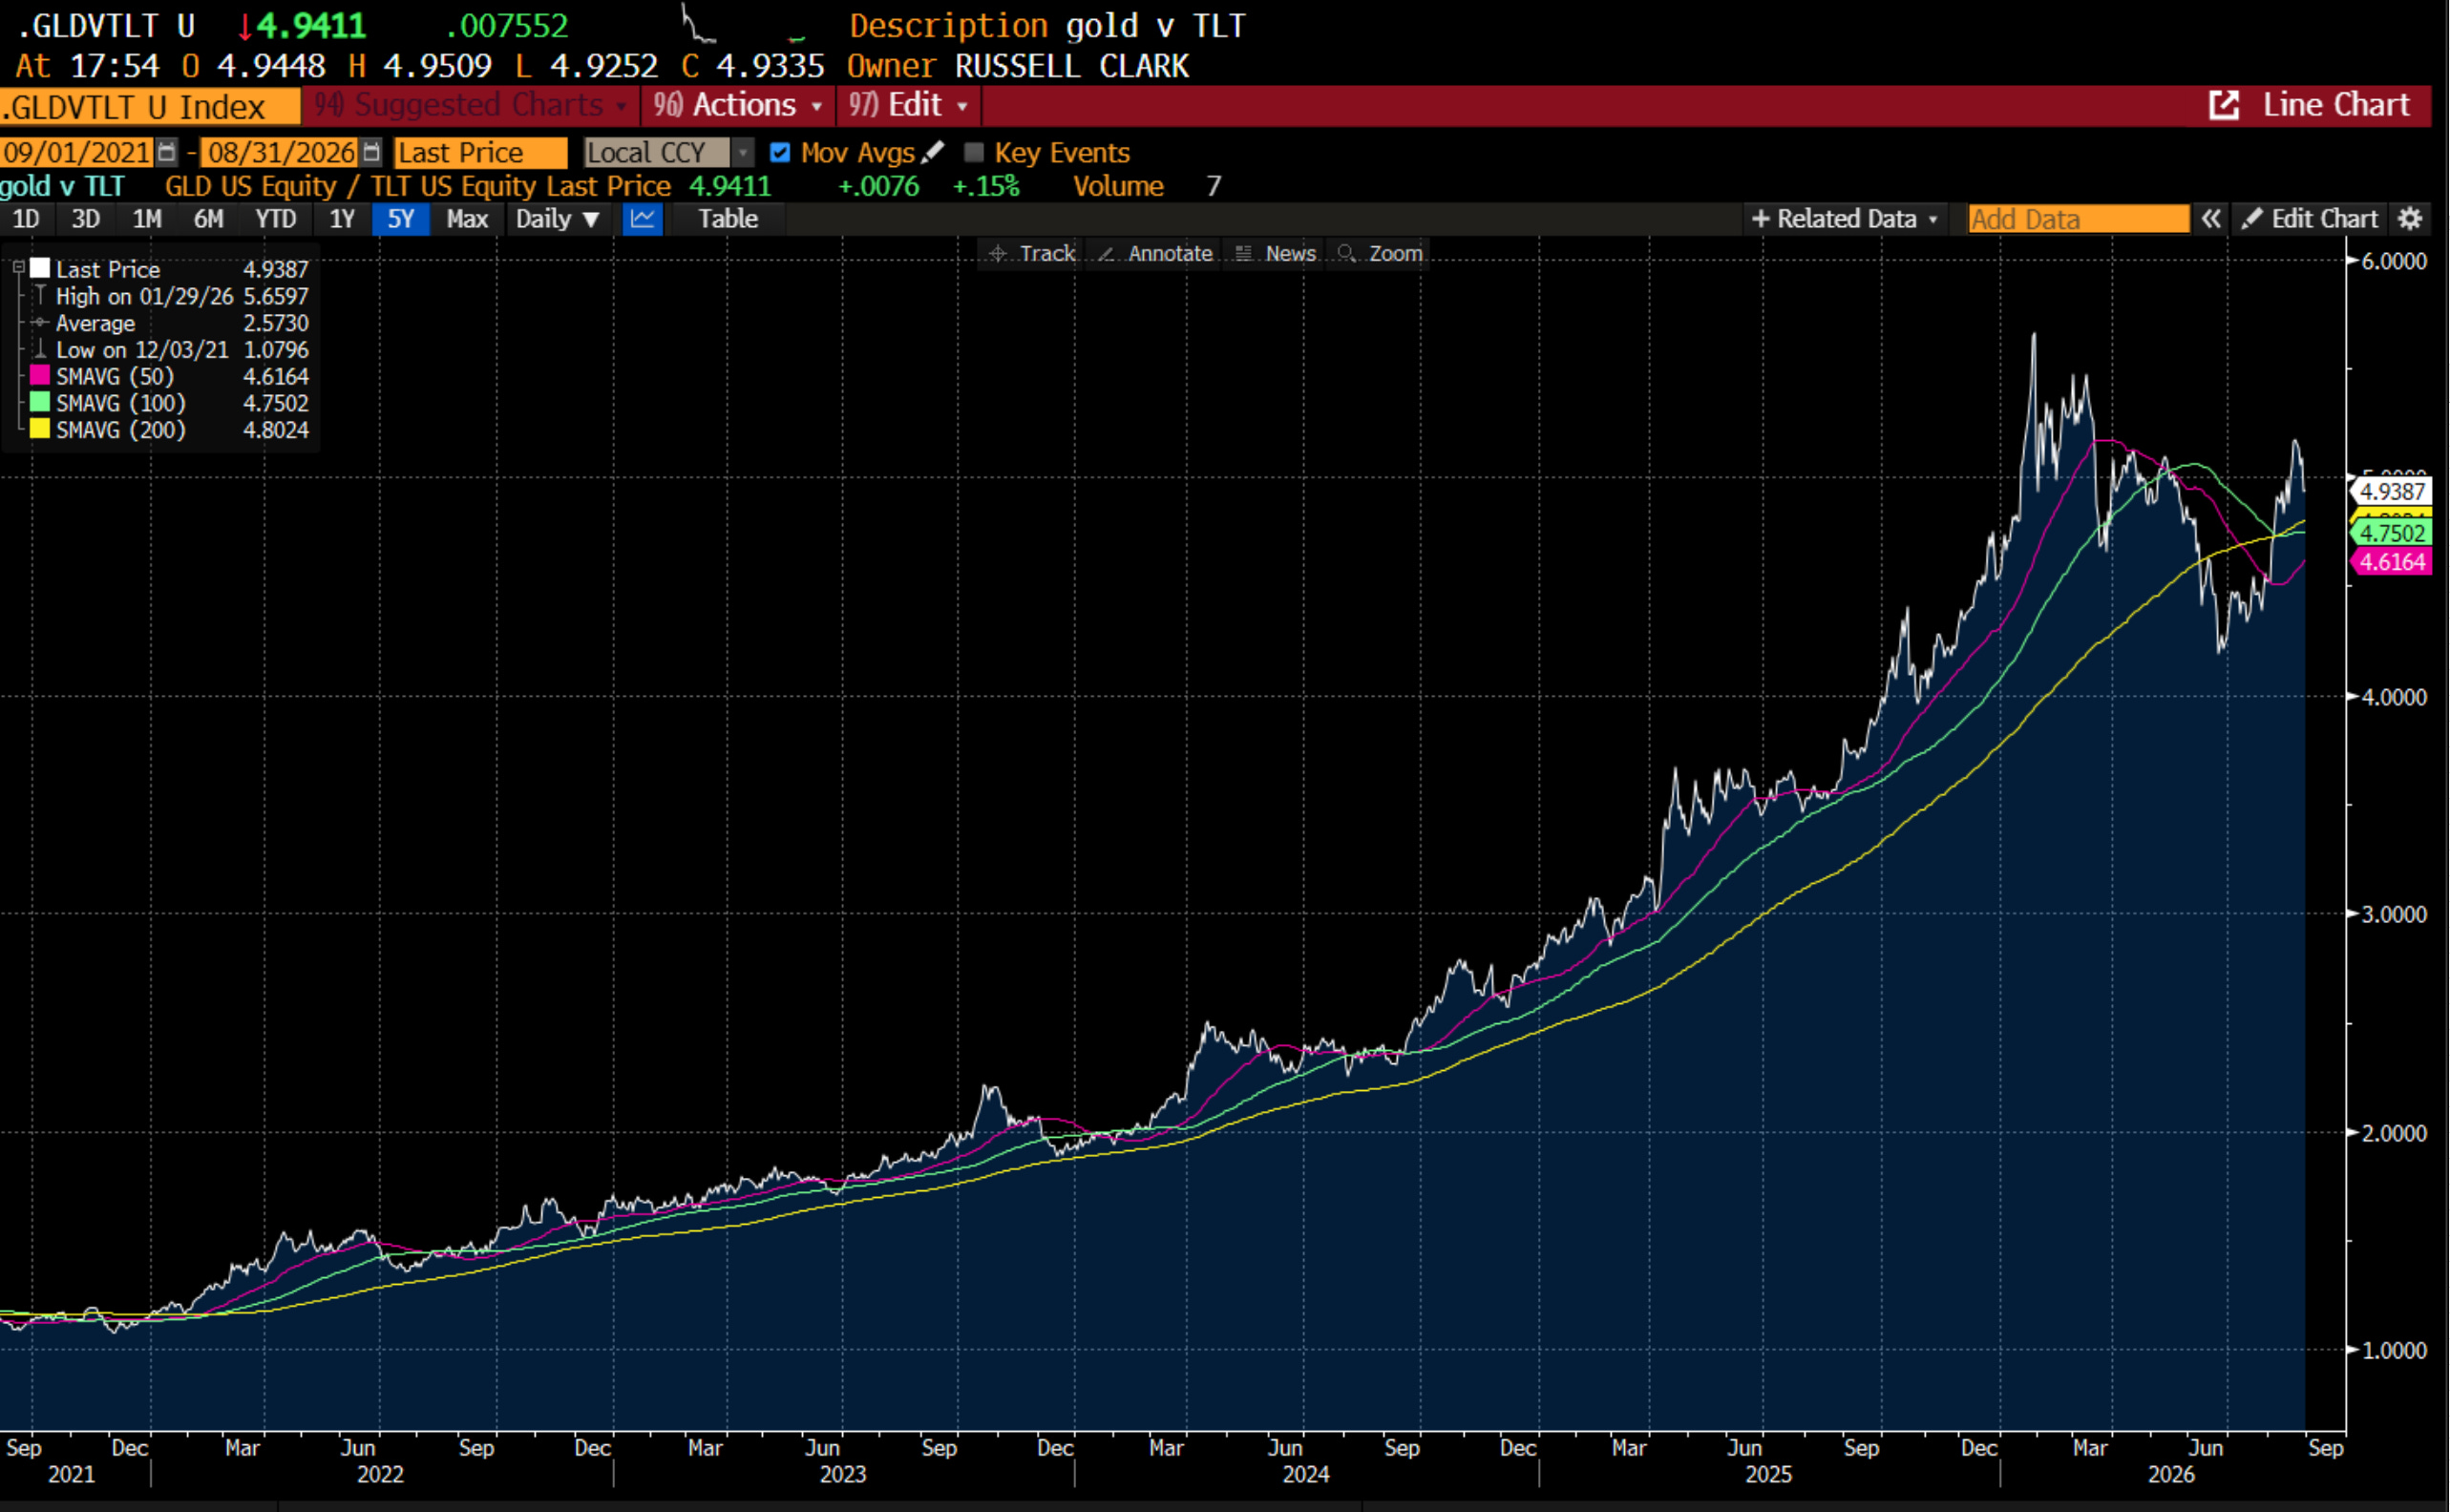
The most pleasing aspect of August was the rally in GLD/TLT to recapture the 200MDA. My view on this is that this will continue to do well until rising bond yields forces the US government to take fiscal deficits seriously. The two big events of the month was that the US Treasury tried to control bond yields rather than control spending (expected and good for gold) and that the Federal Reserve was more hawkish than anticipated (also expected and bad for gold, but also bad for bonds). I did wonder what happens to GLD/TLT when Donald Trump comes to the end of his term - but over the summer I realised that Donald Trump is just the face of a political belief system that is now heavily entrenched in US politics. There is no going back, not until crisis forces change.
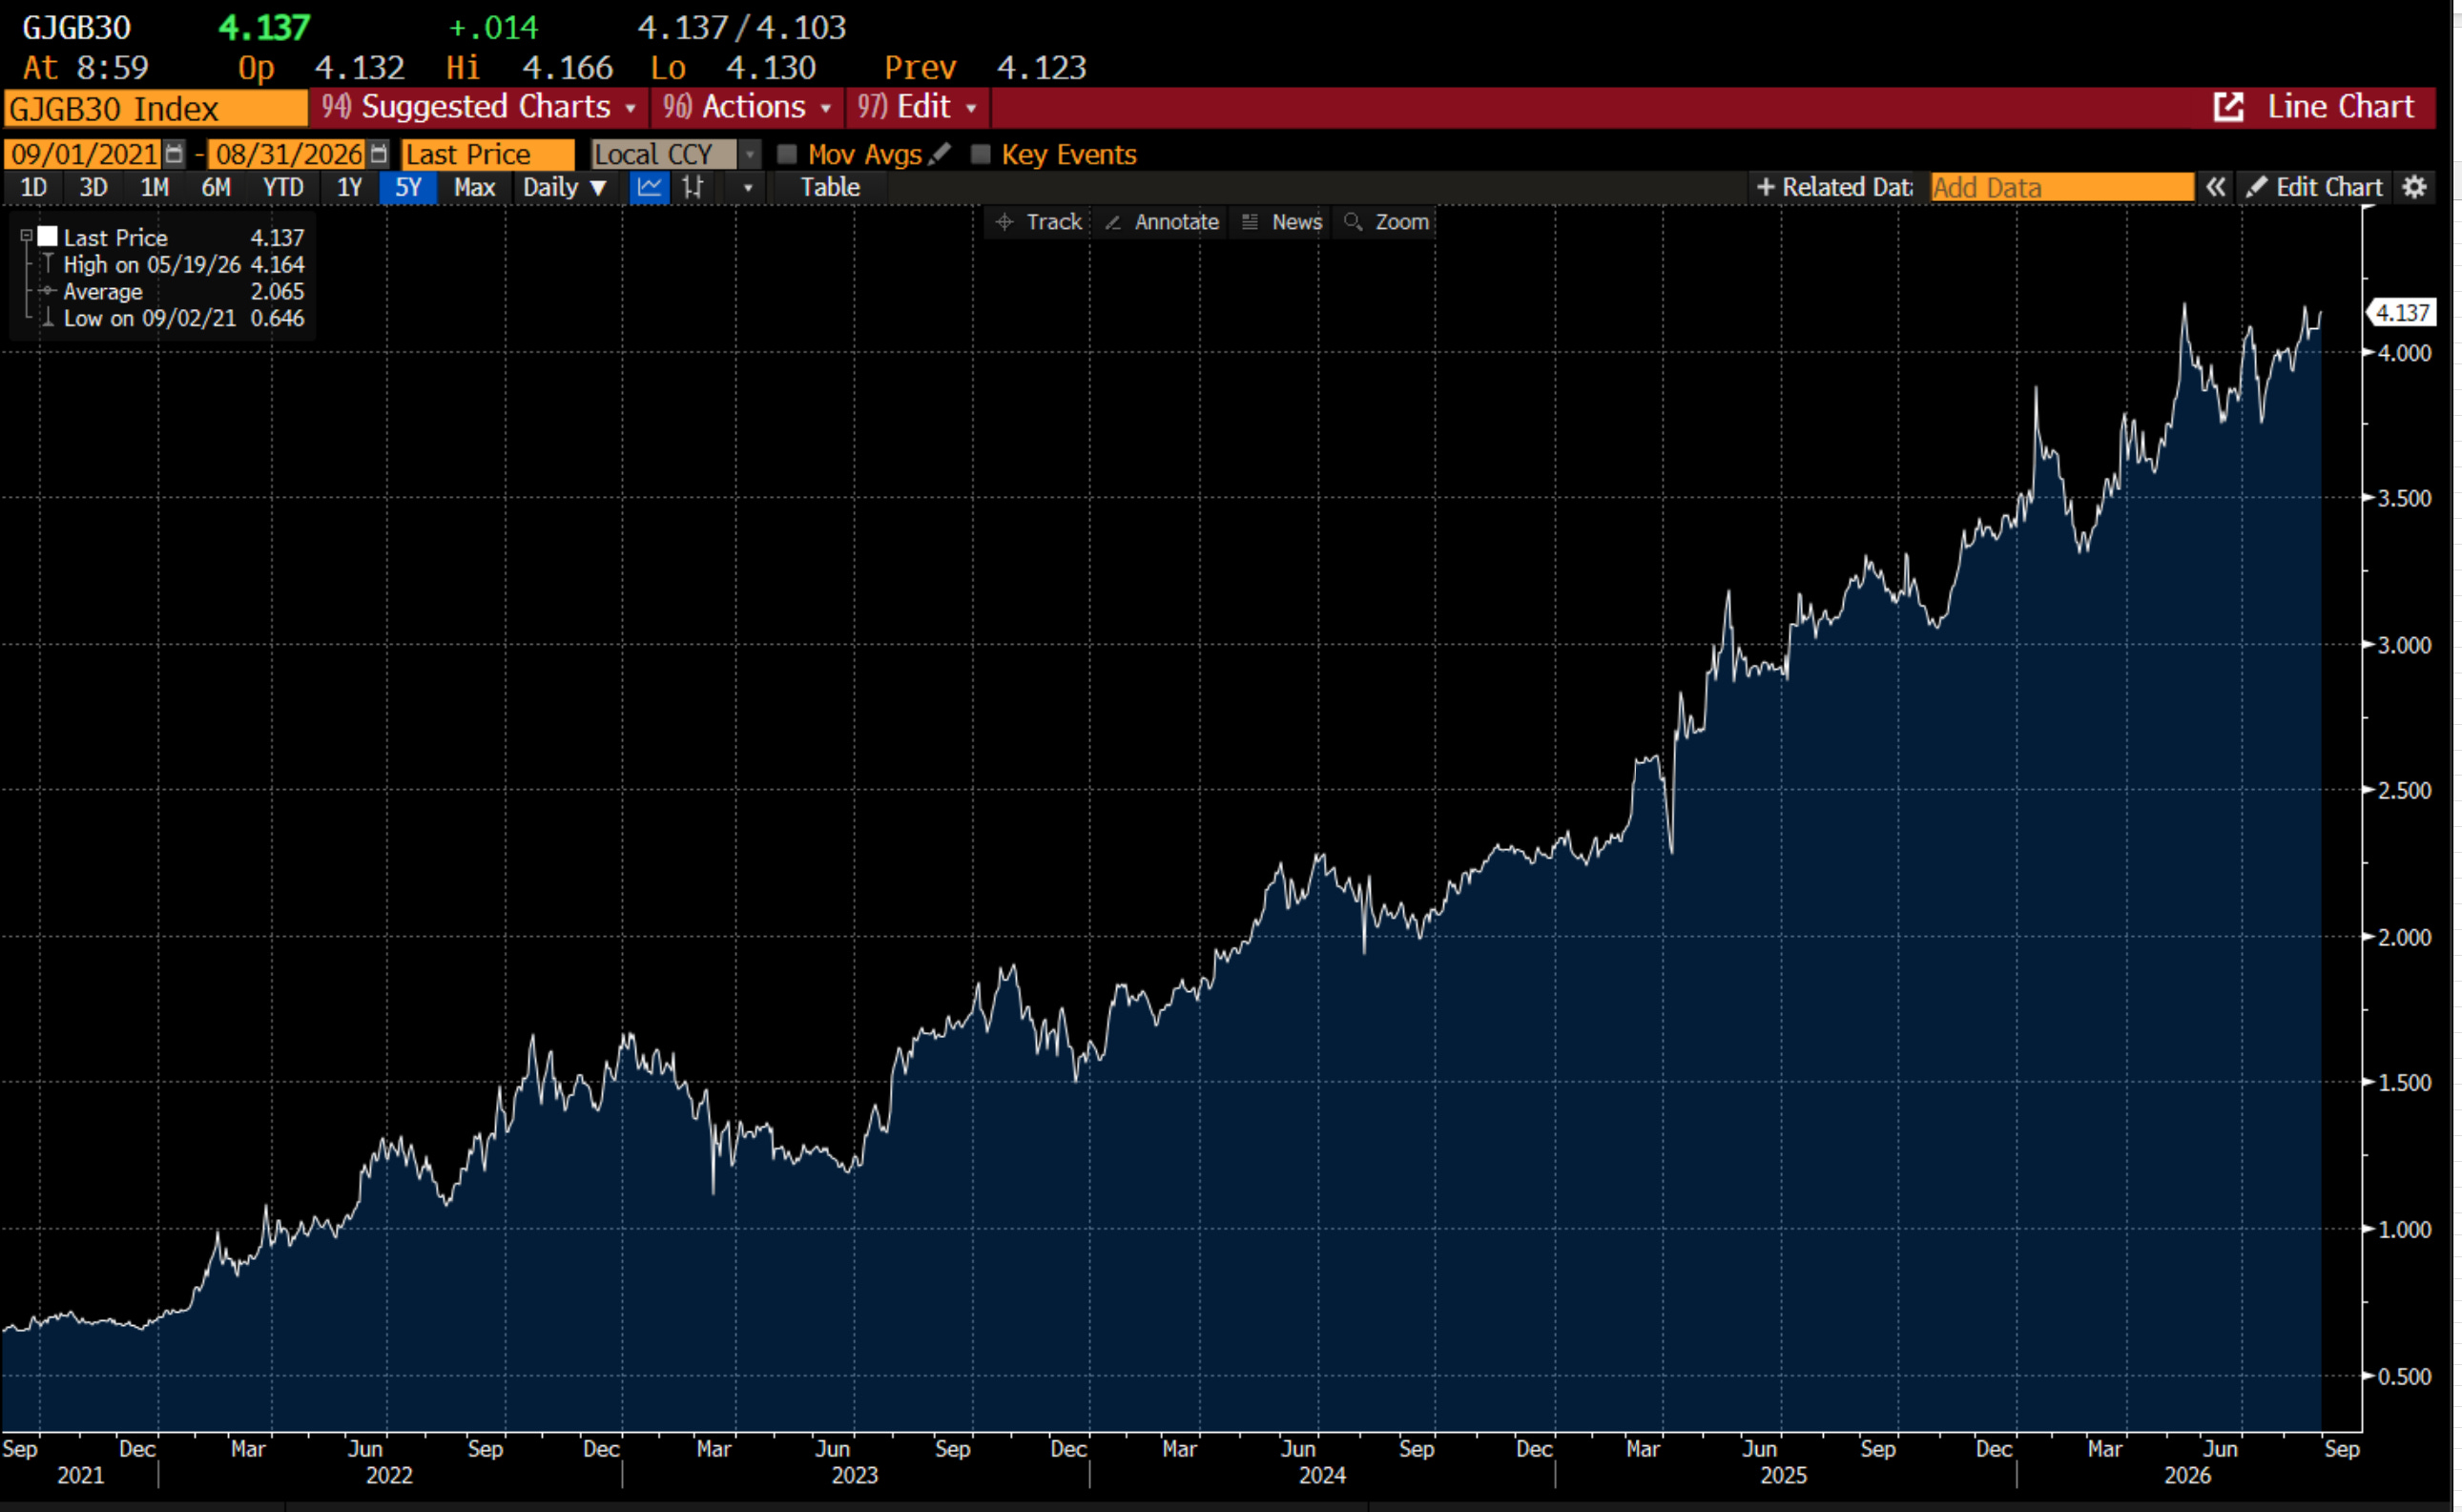
I was also happy to see Japanese bond yields to go higher. 30 year JGB yields have moved through 4%.
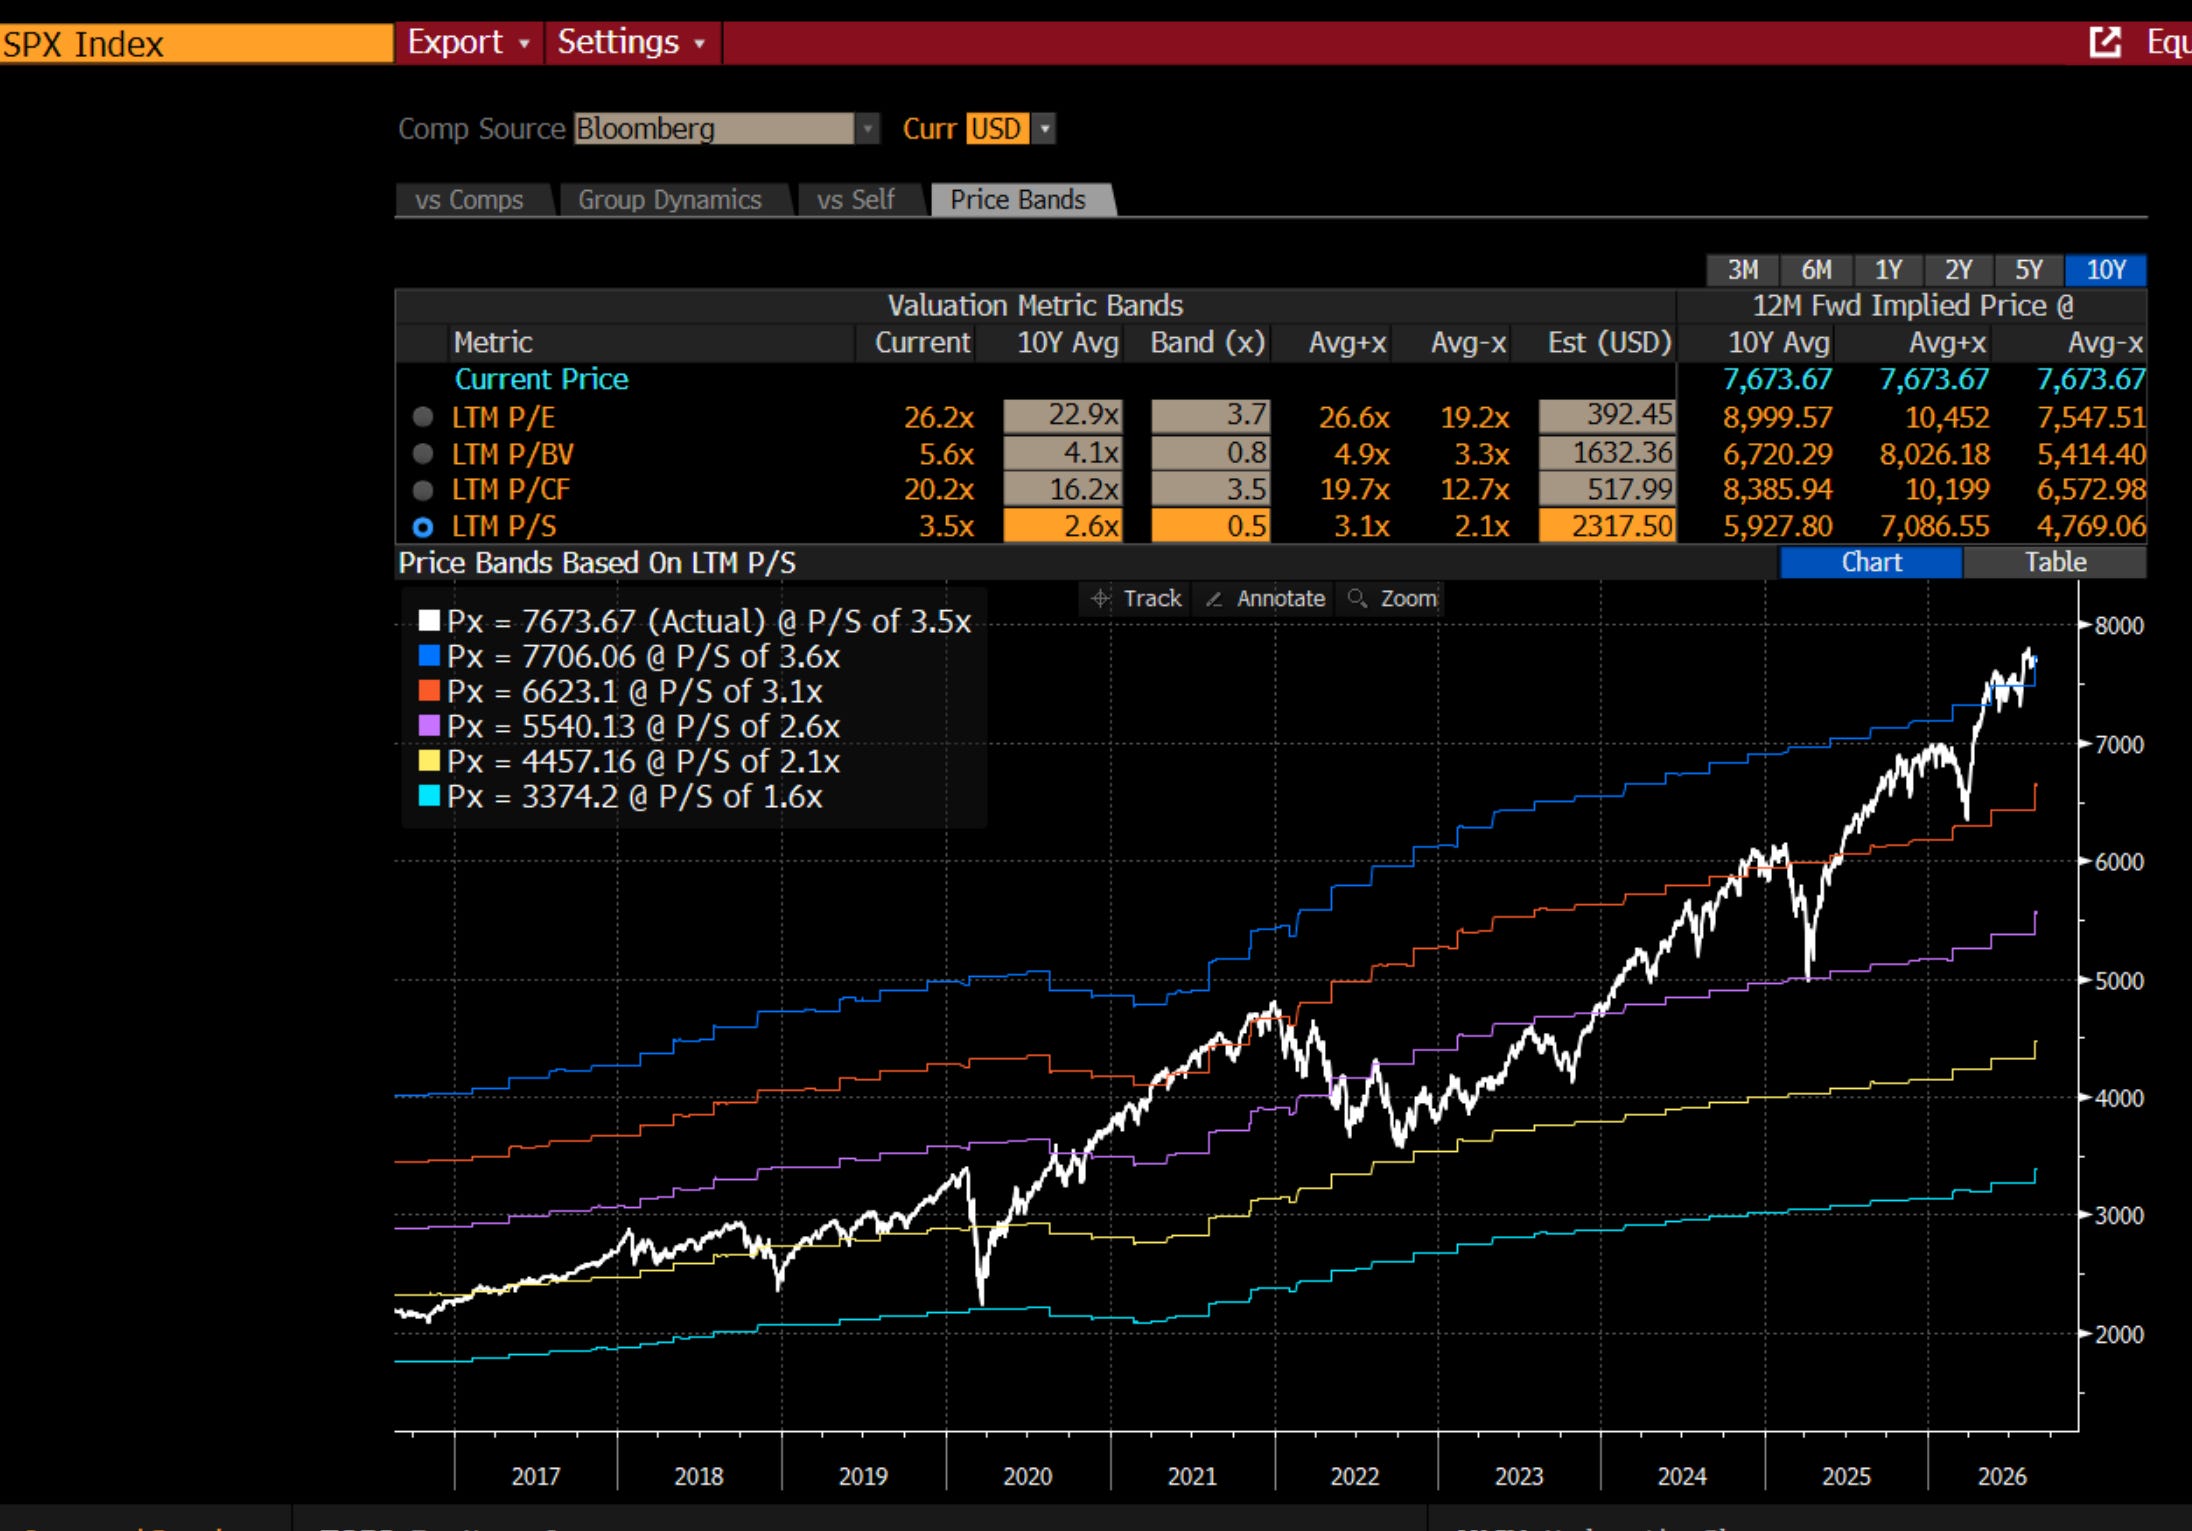
I thought this would have a negative “reaction” on US stock valuations. This has not been the case at all. Valuations have moved higher. I use price to sales below
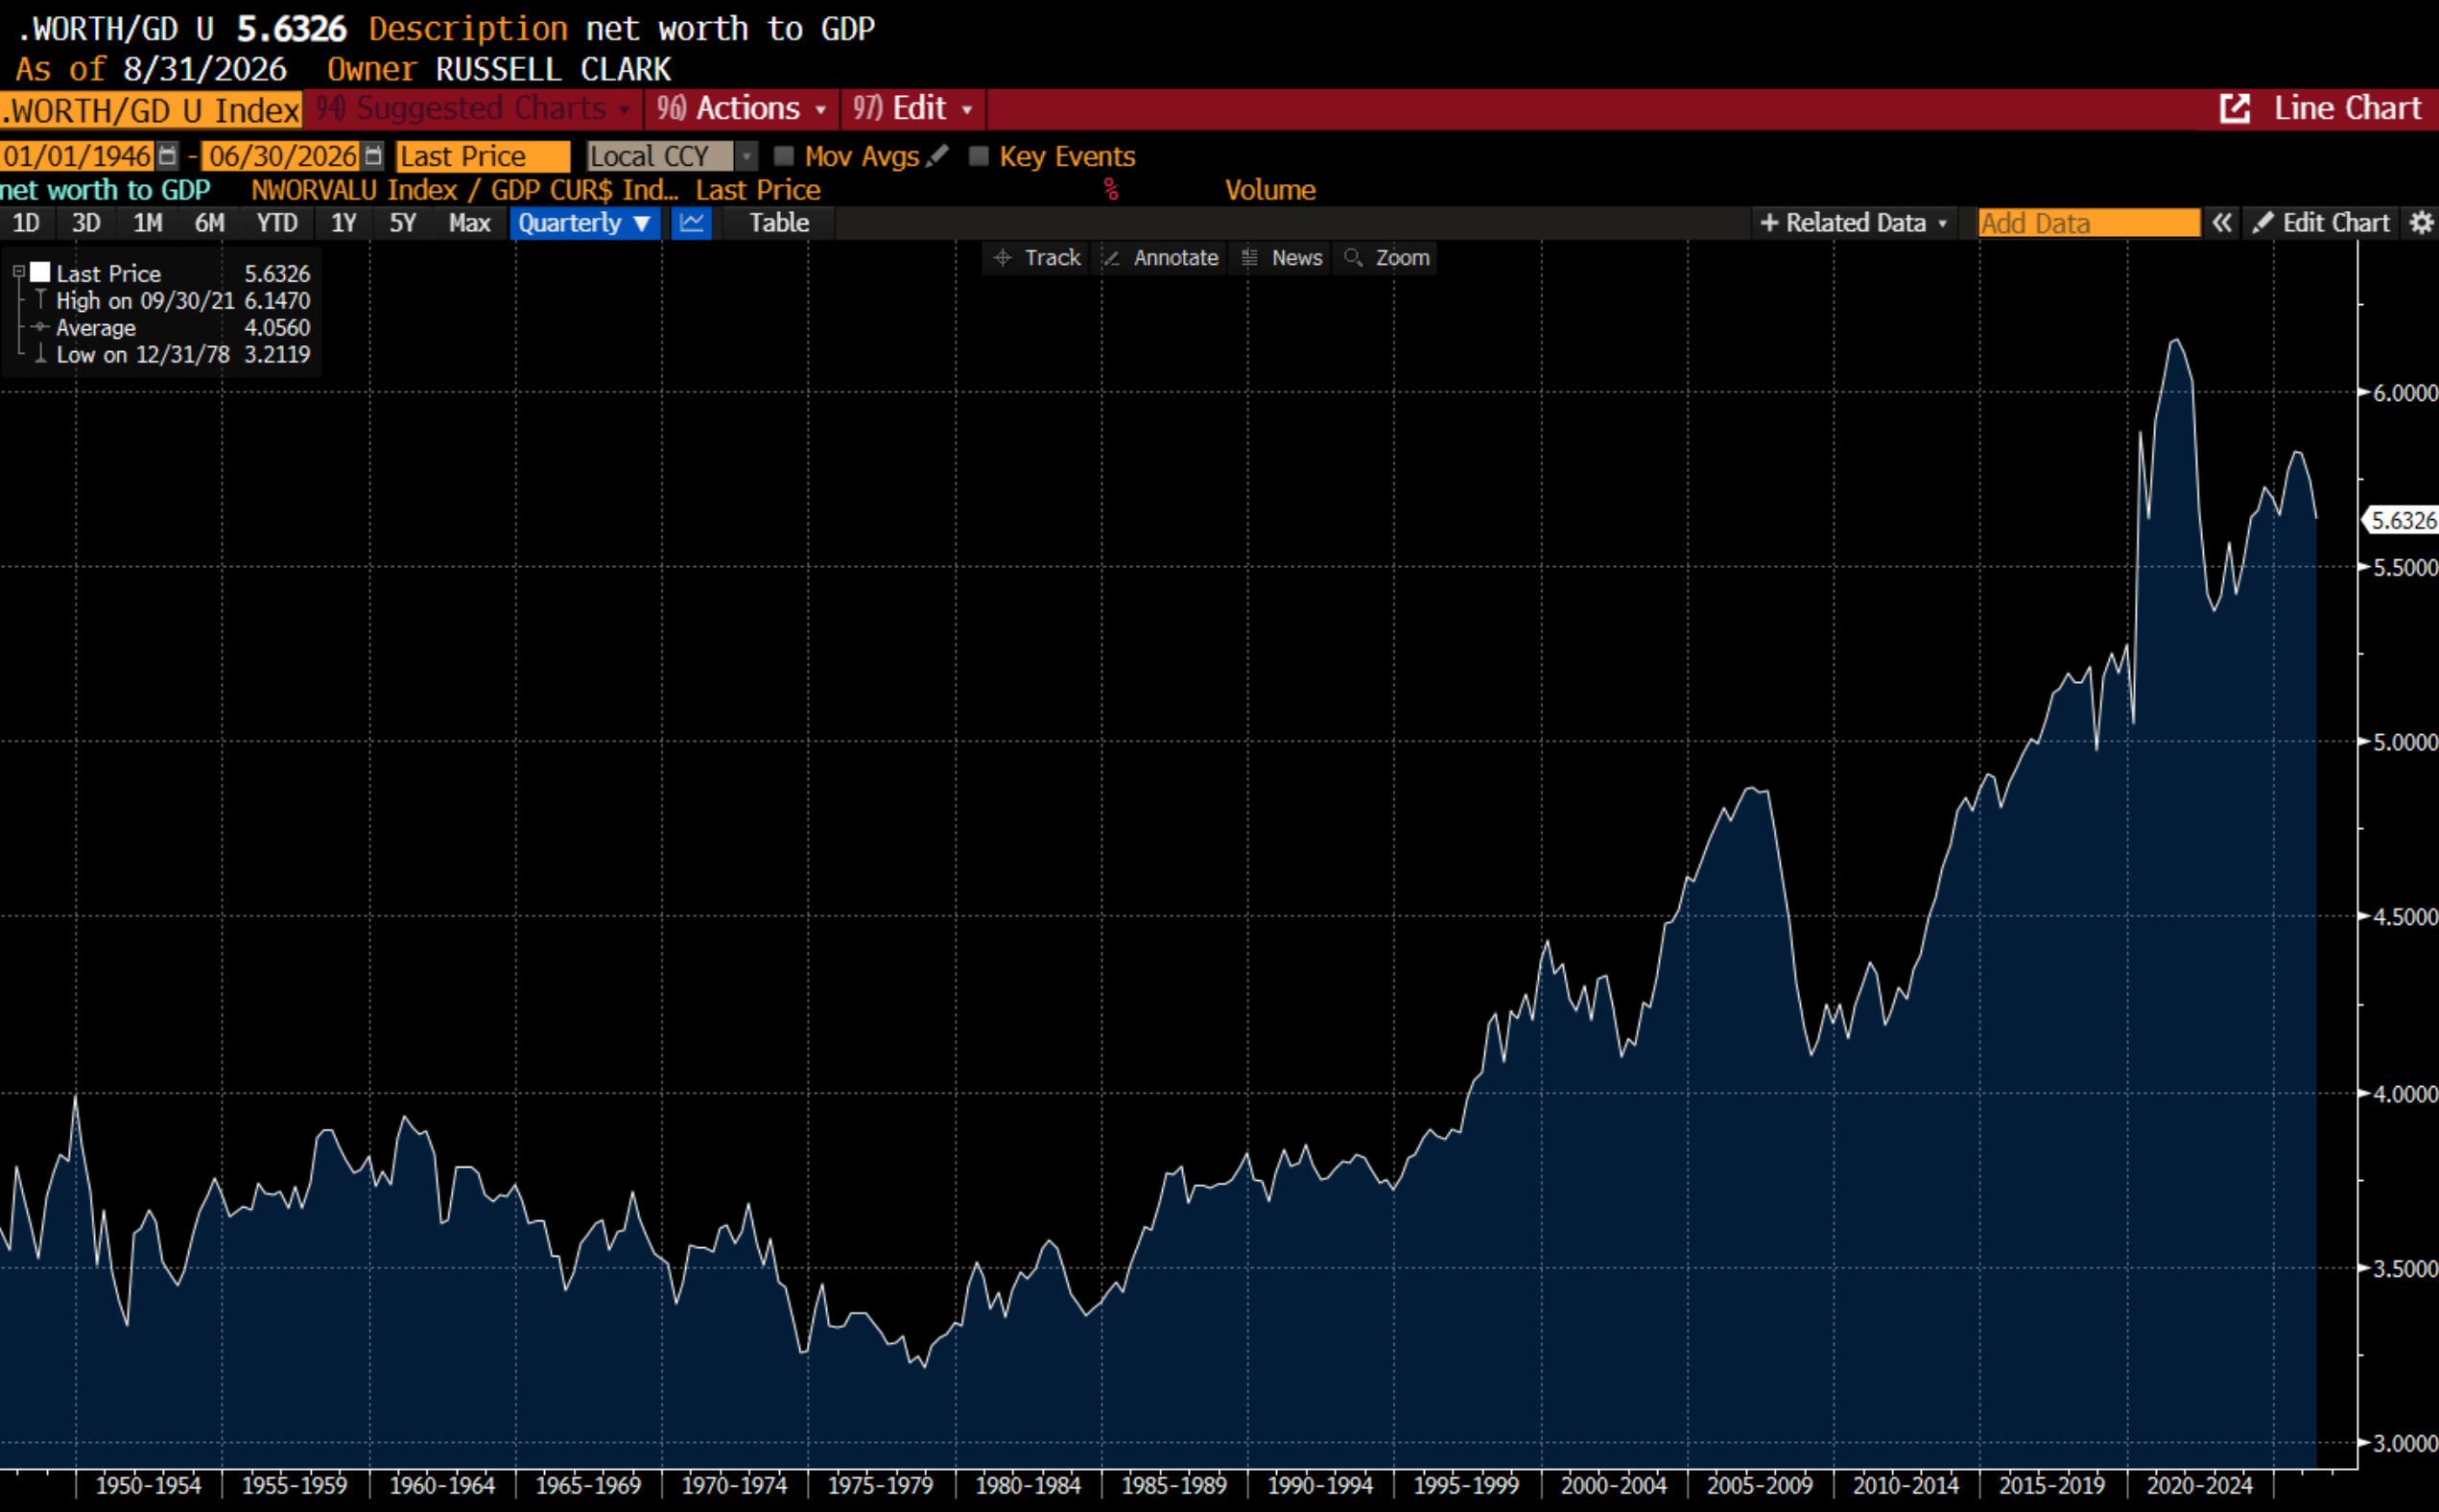
Another way to look at this would be that financial assets relative to income would fall. This has not really happened yet either. Below is the Fed Fund Flow data, household net worth divided by GDP. This is slightly out of date - but we are still around 600% of GDP.
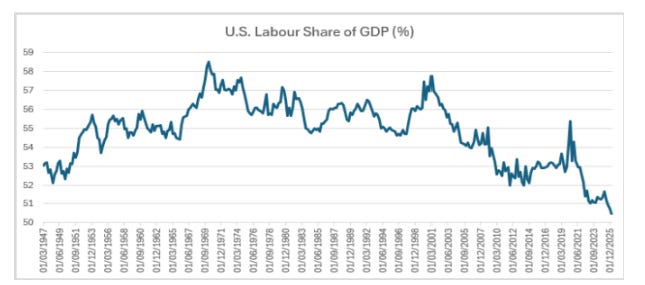
Or to borrow a chart from MacroStrategy, labour share of GDP continues to fall in the US. For what it is worth, I always felt that 1999 was the pinnacle of the US - asset prices were reasonable, workers fairly compensated, and politics was far more cordial. I did think Donald Trump would make more of an effort to take care of his base - but plainly he has other ideas now. Still, when the political reset comes - inflation will be all the higher for it.
What intrigues me most about markets at the moment is that credit is sending negative signals. Hyperscaler CDS is one example, but also the KDP High Yield Daily. It has risen this year.
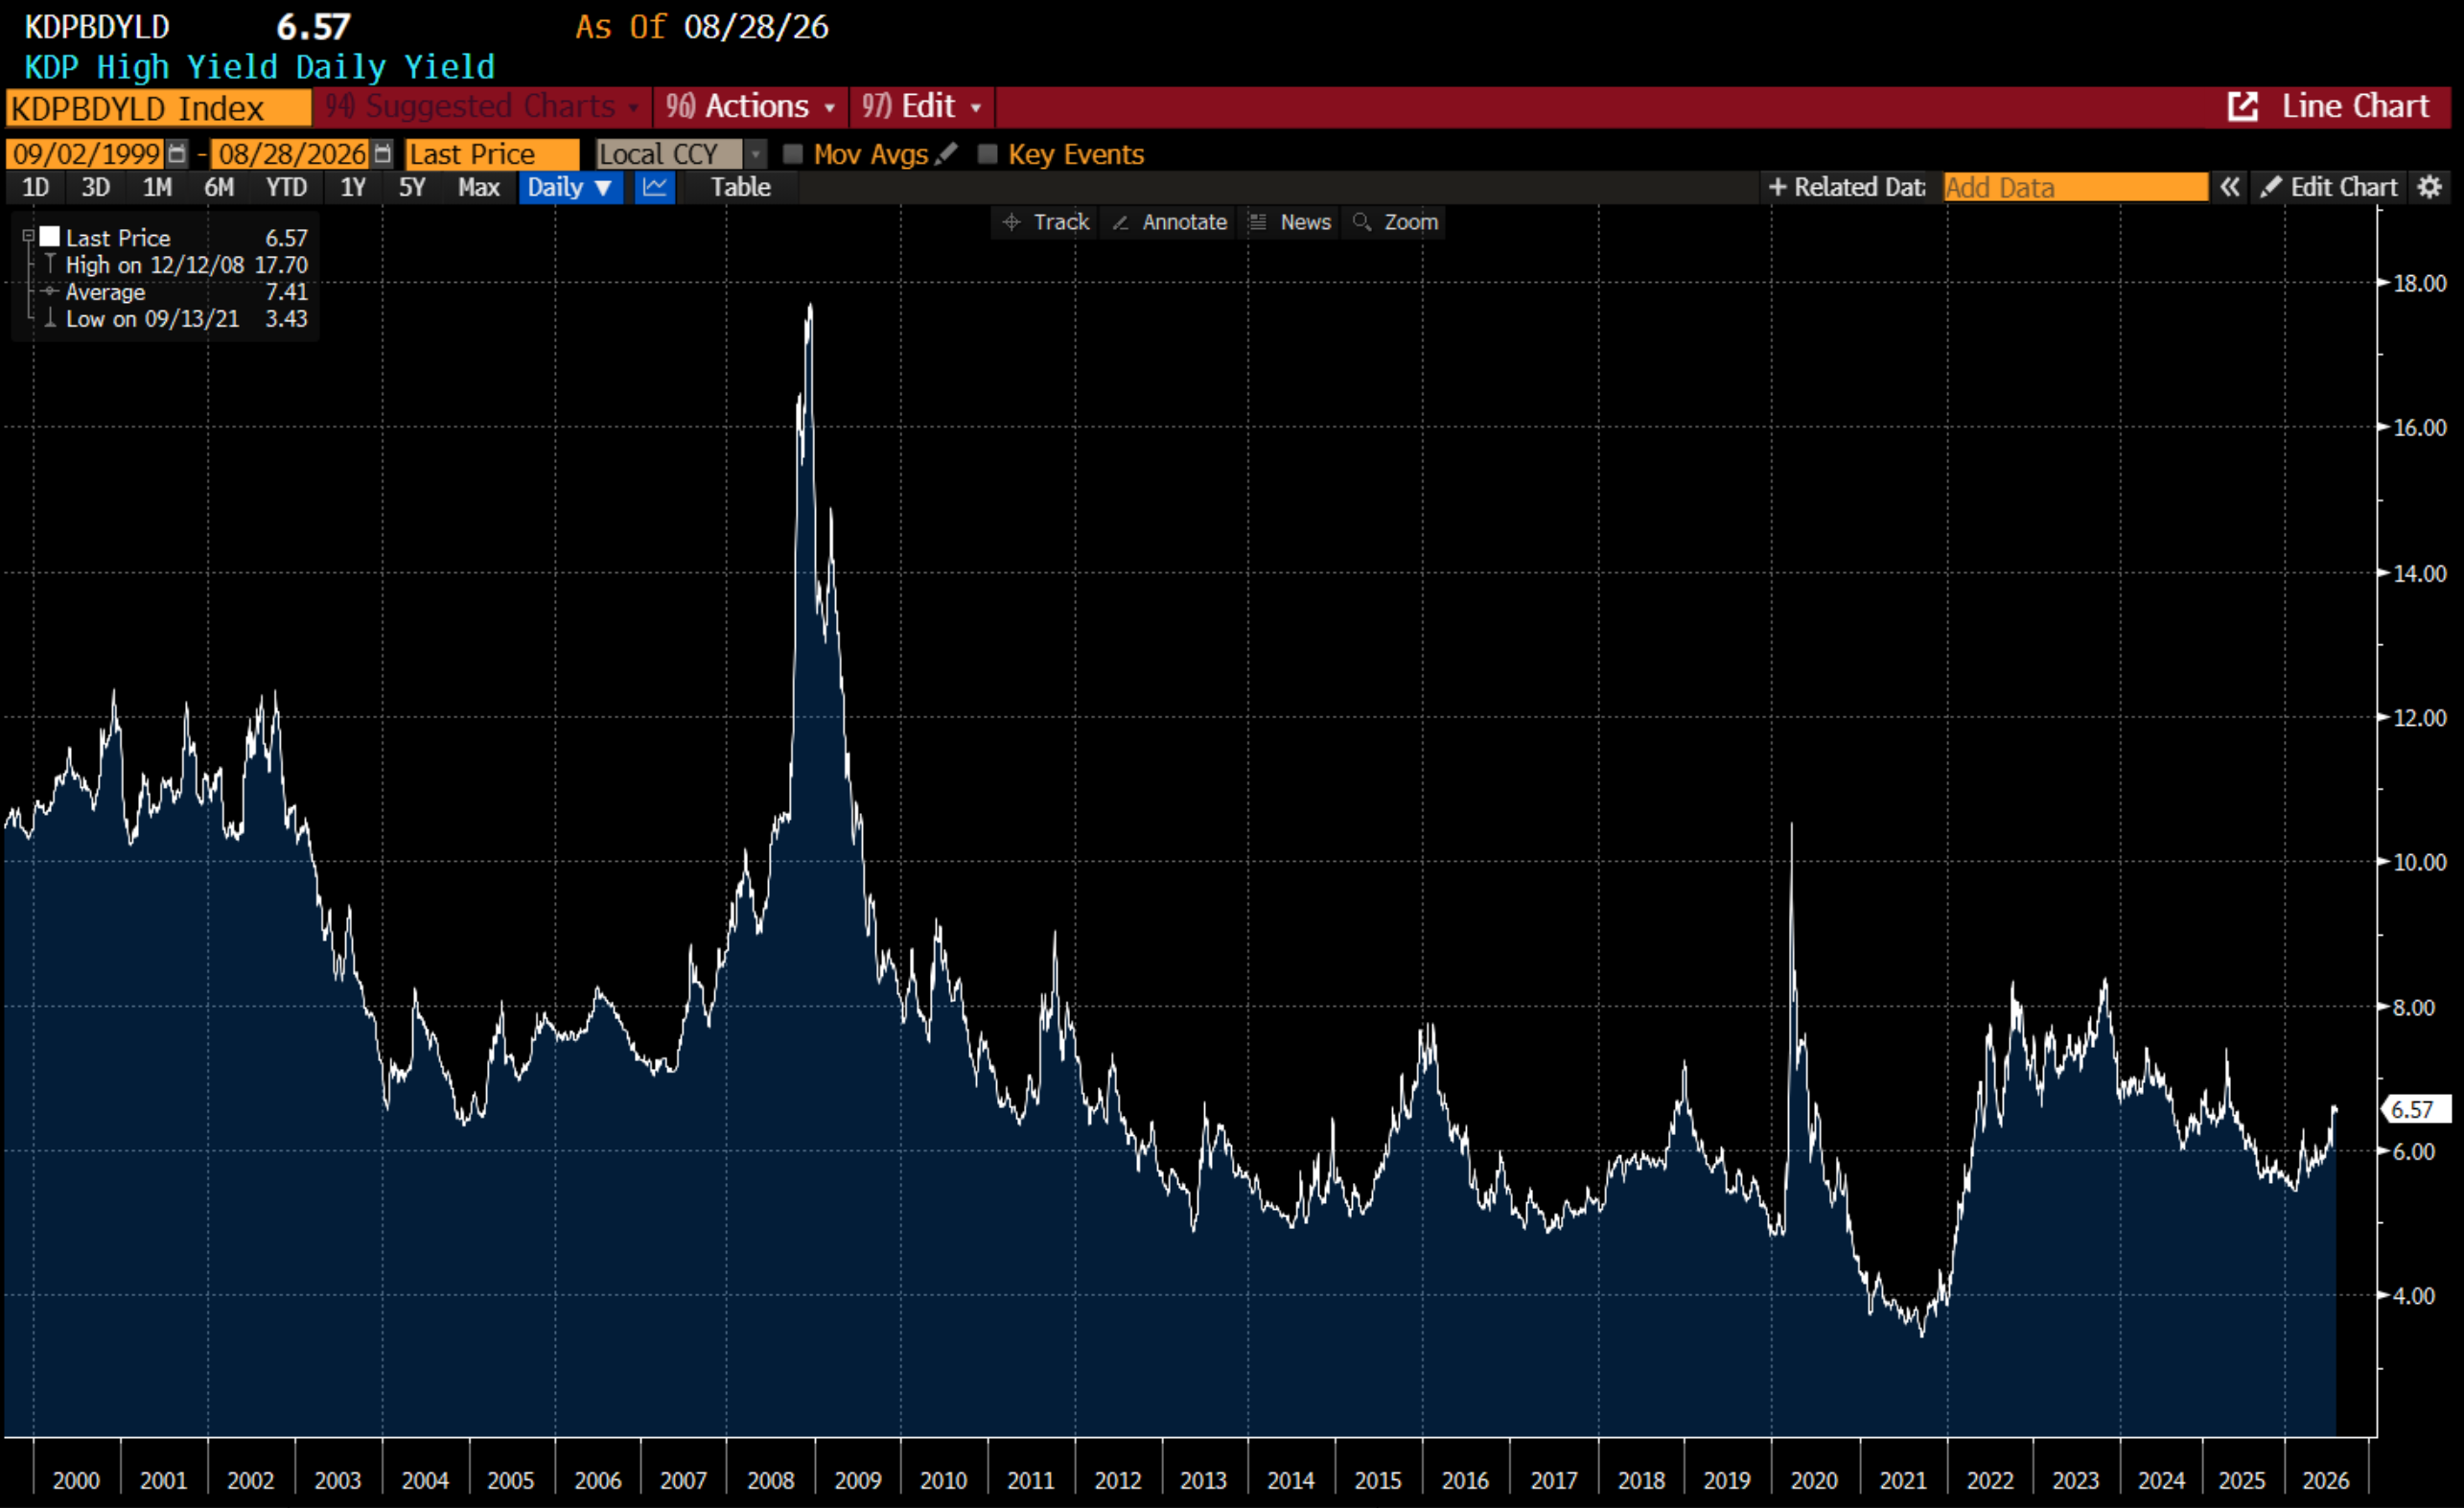
But according to Goldman Sachs, the most shorted stocks have surged over the last year. What does this mean? It means short sellers have been driven to the wall, even as the credit signal is saying its time to get short. That tends to be a bearish set up.
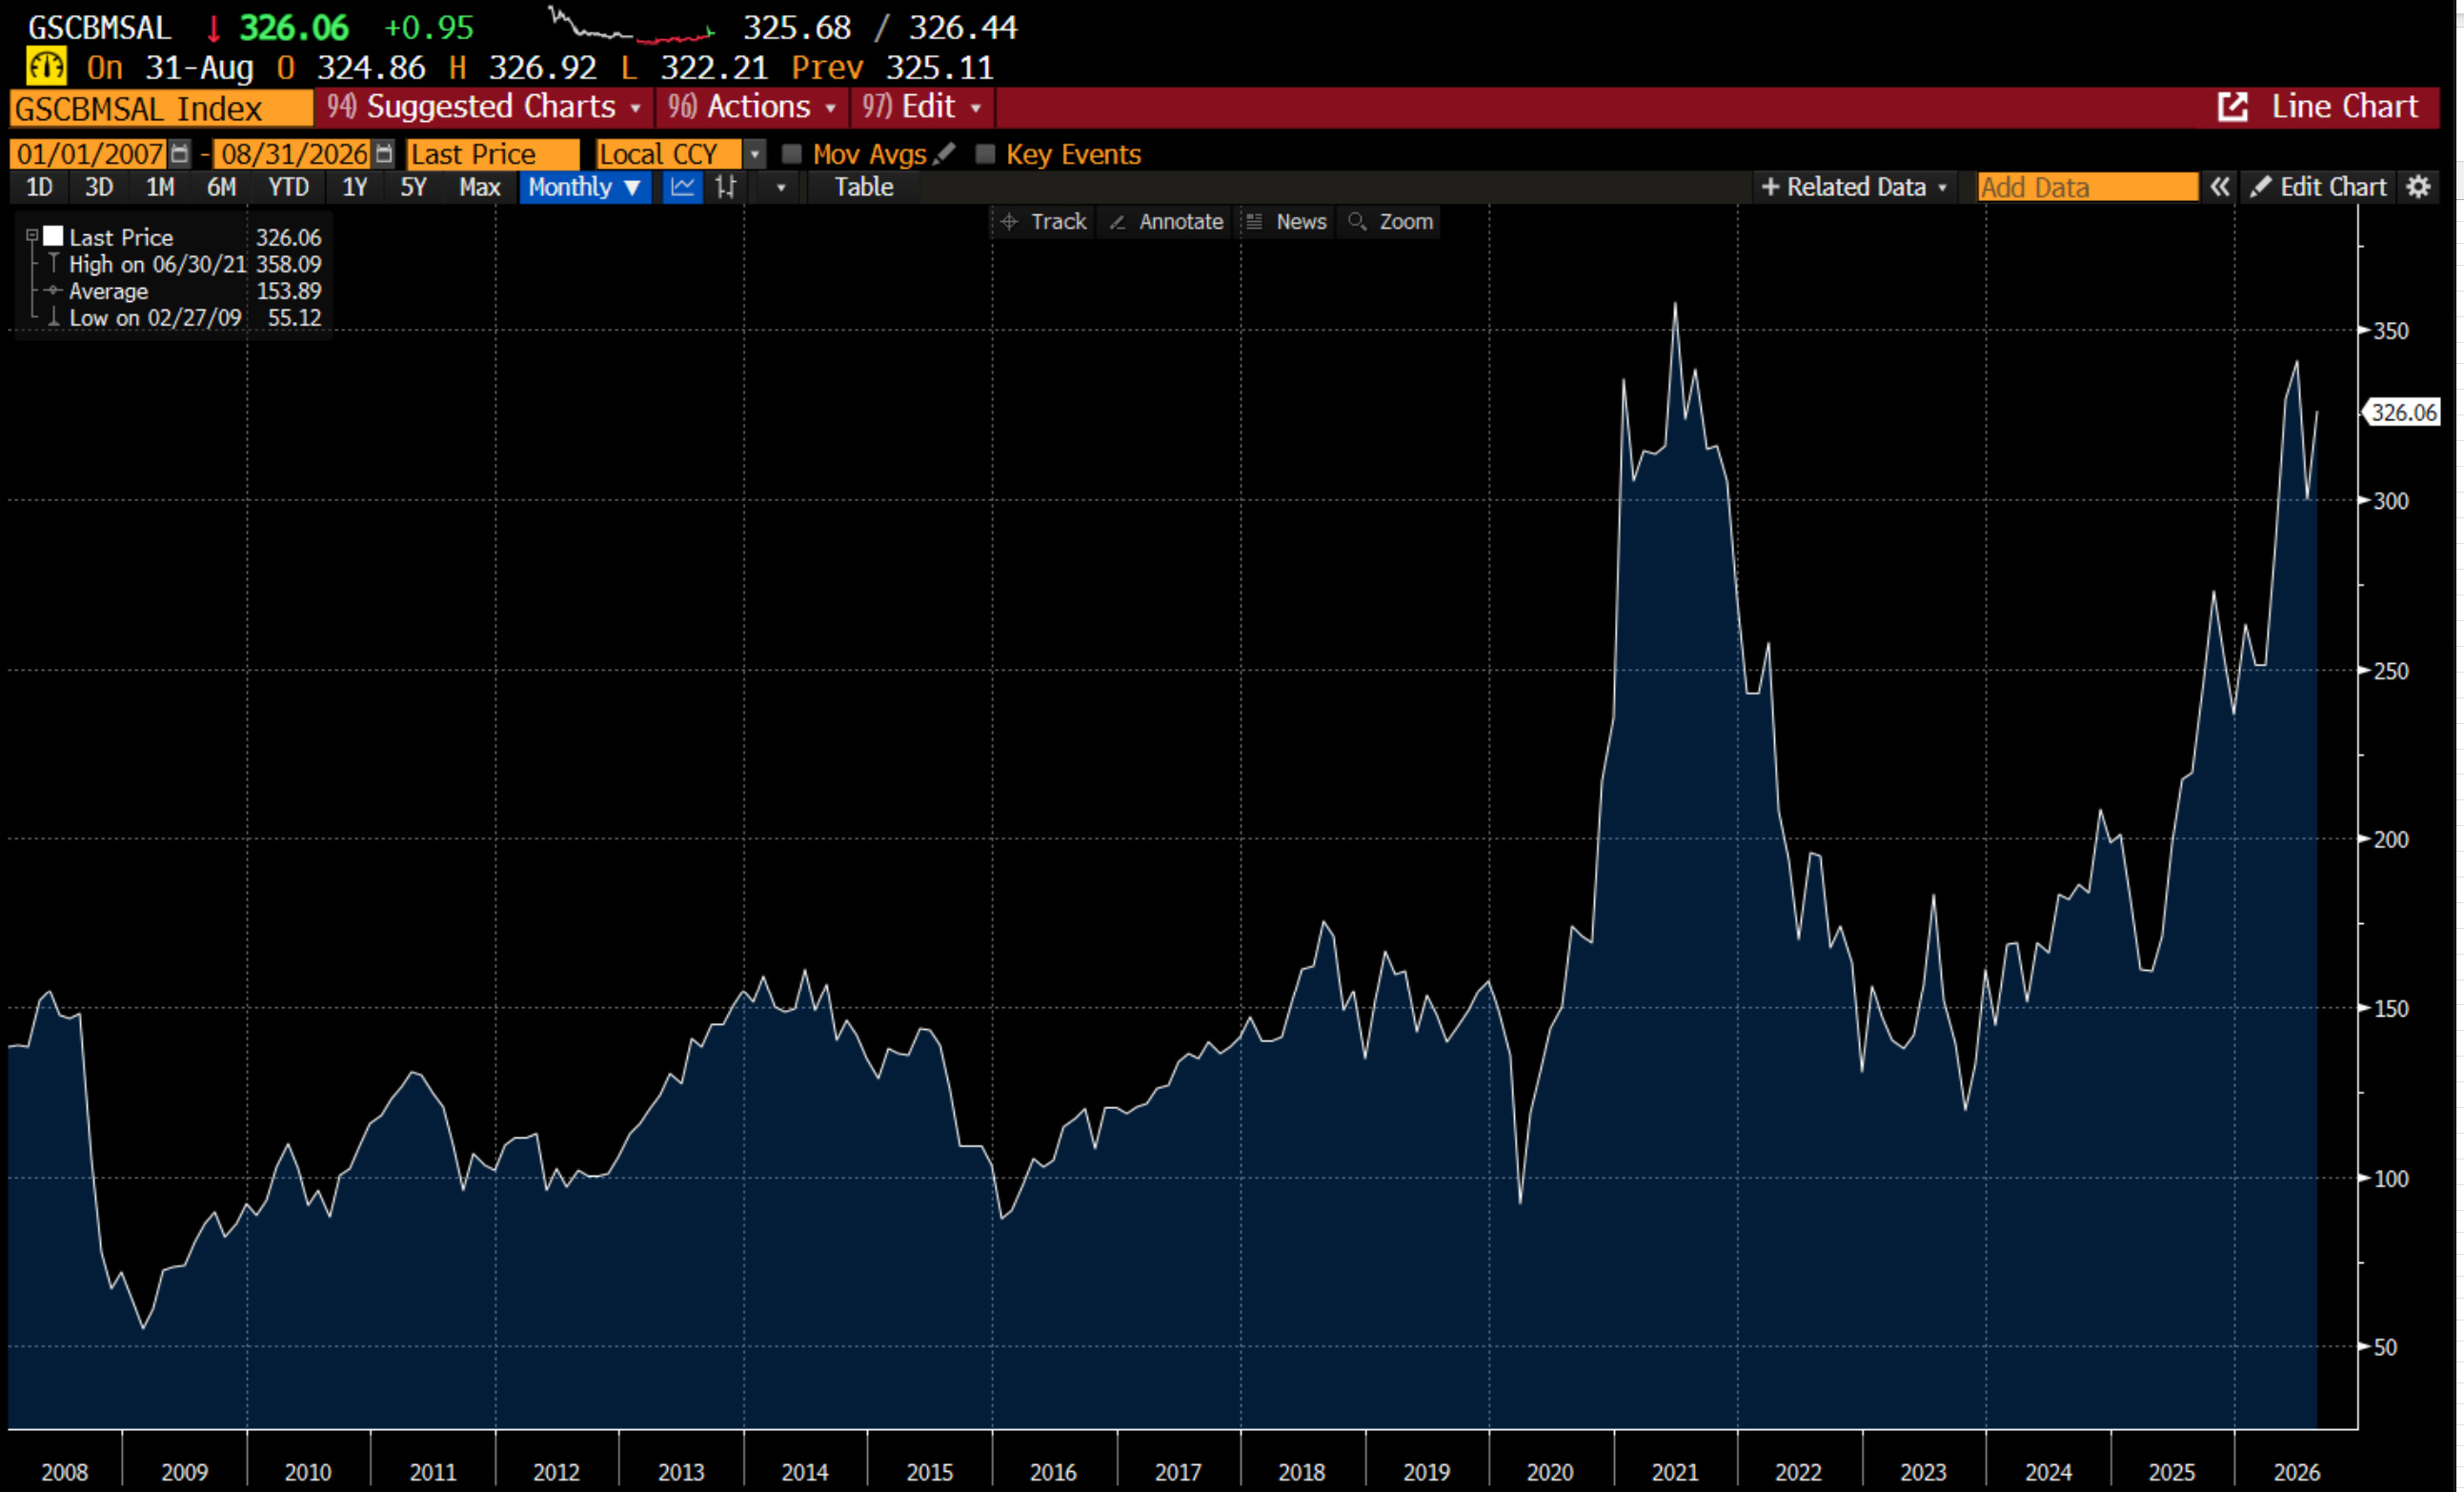
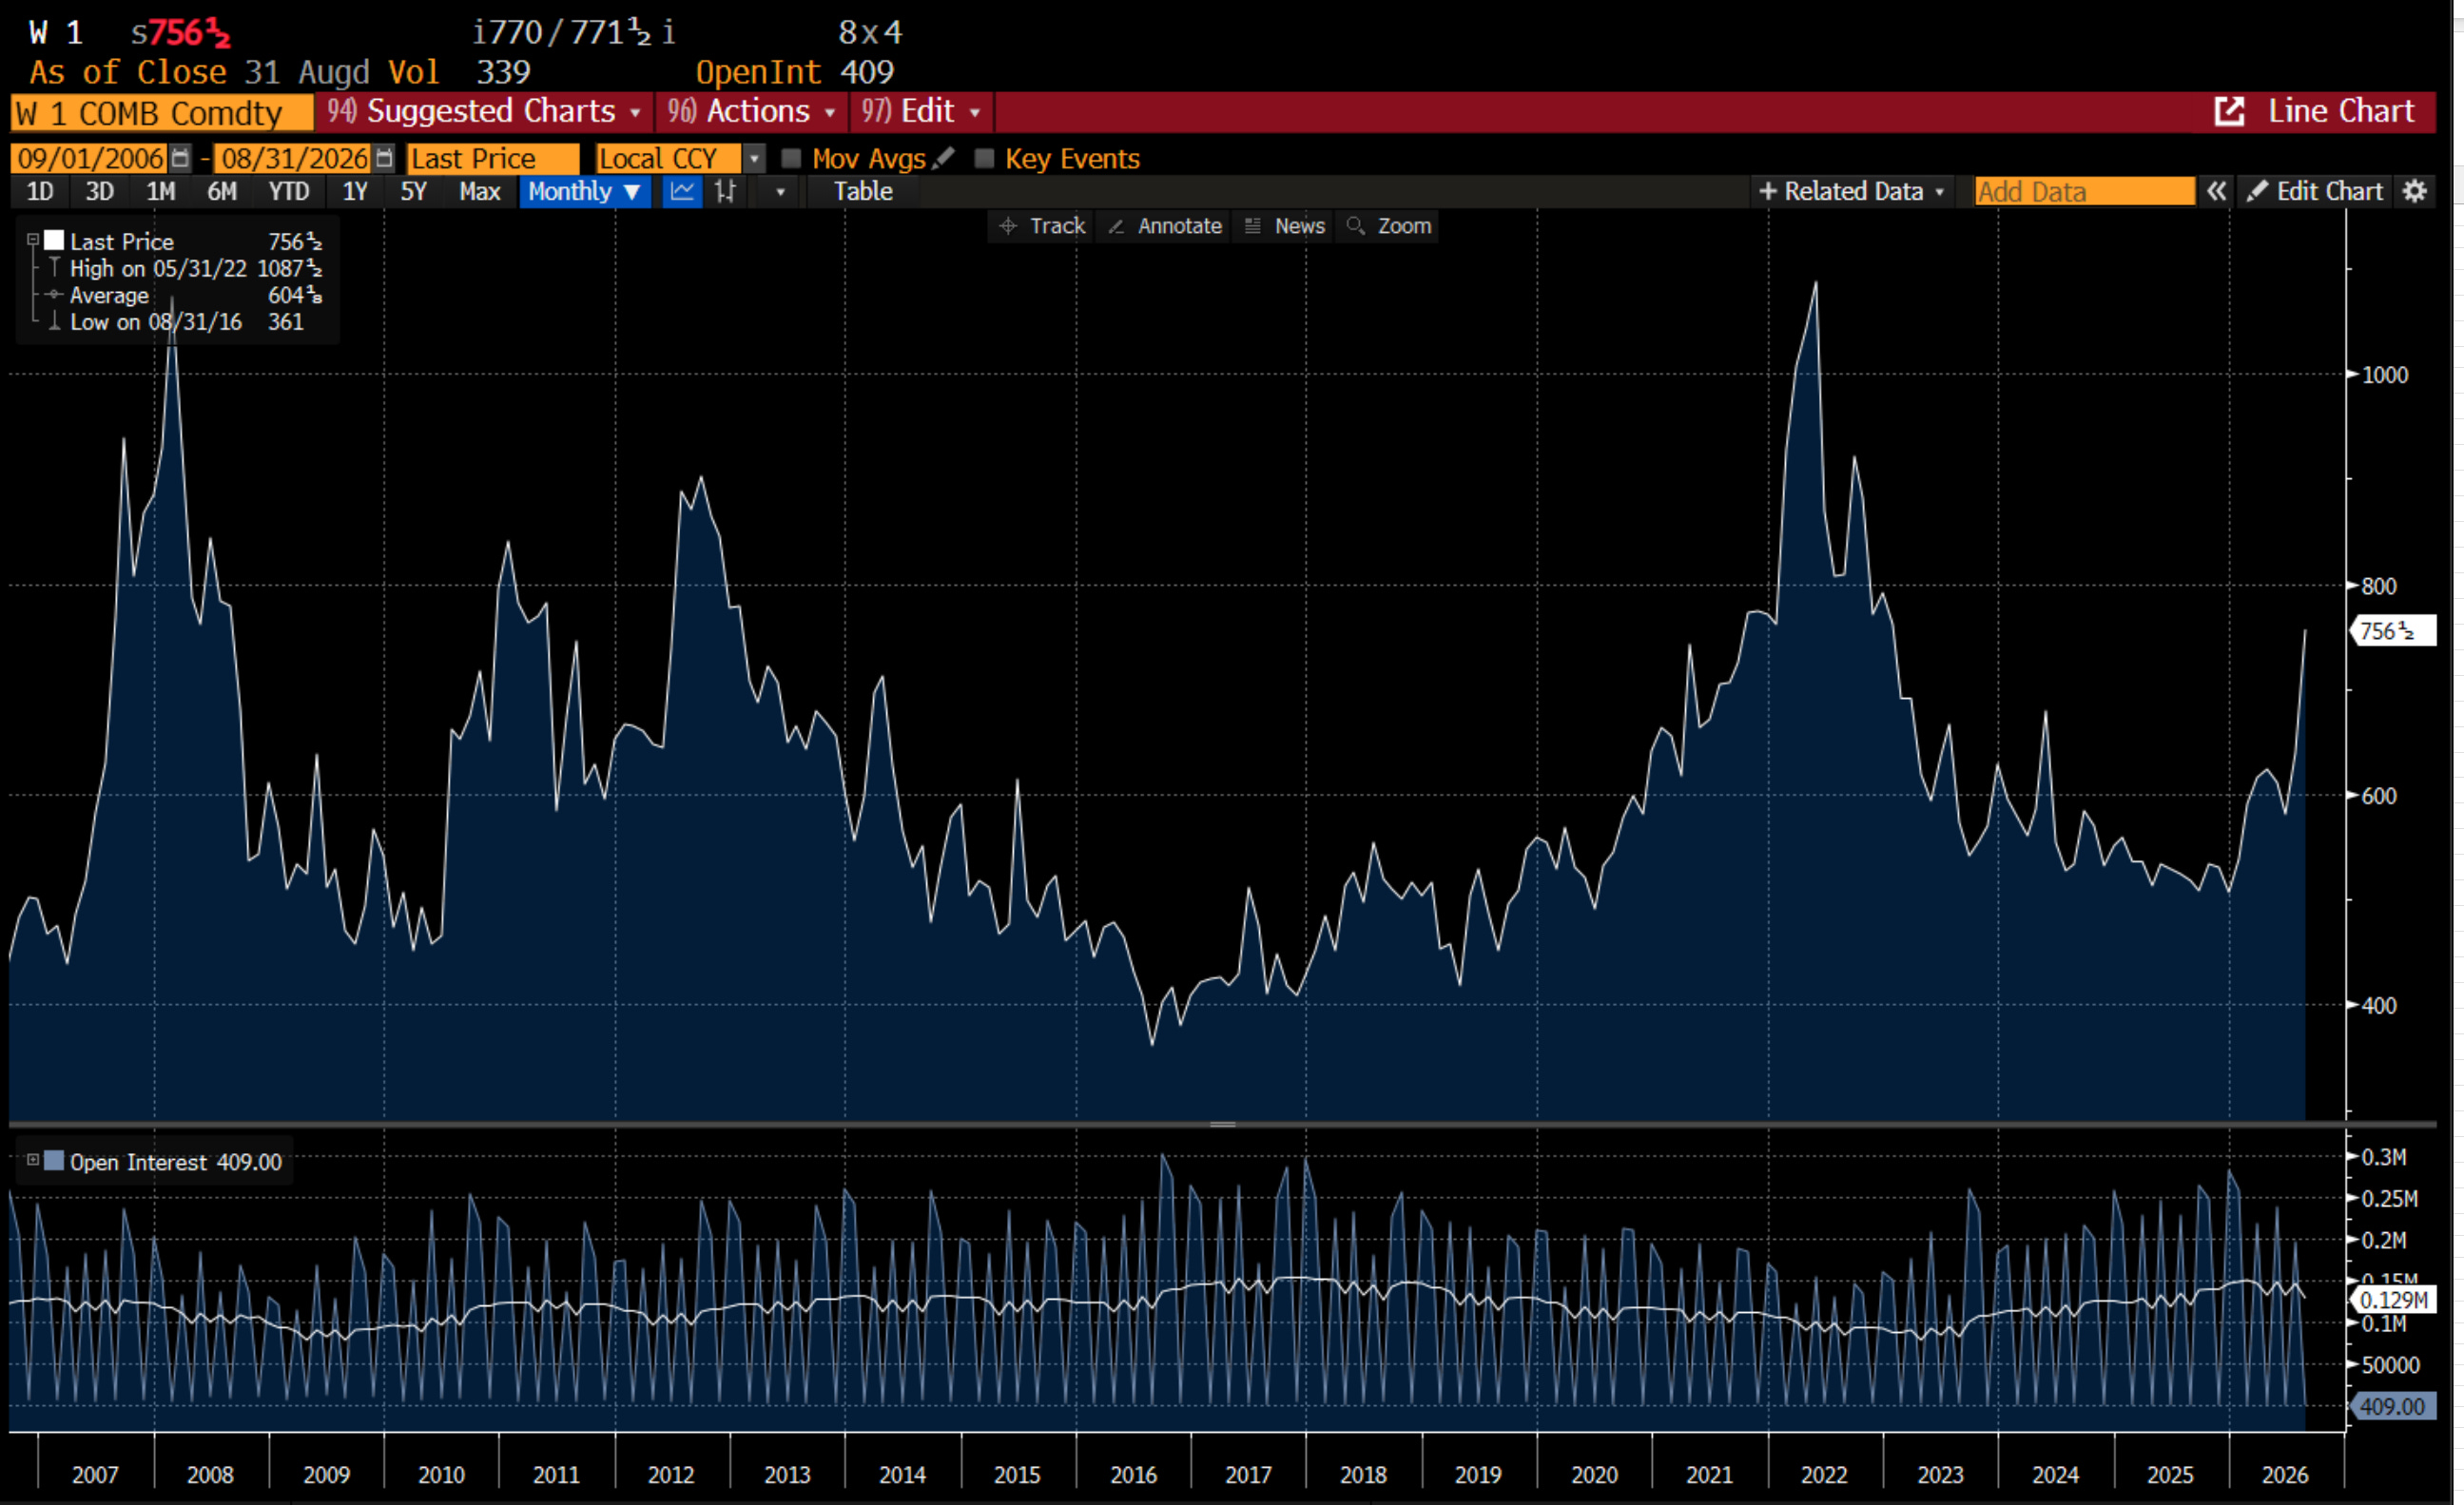
I have also found historically speaking, when wheat prices rise, markets do poorly. Why? Well the breadline is called the breadline for a reason. When food prices go up - the political and economic pressure to do something increases dramatically.
Anyway, to my mind, the short term outlook looks bad. Particularly with a VIX on a 15 handle.
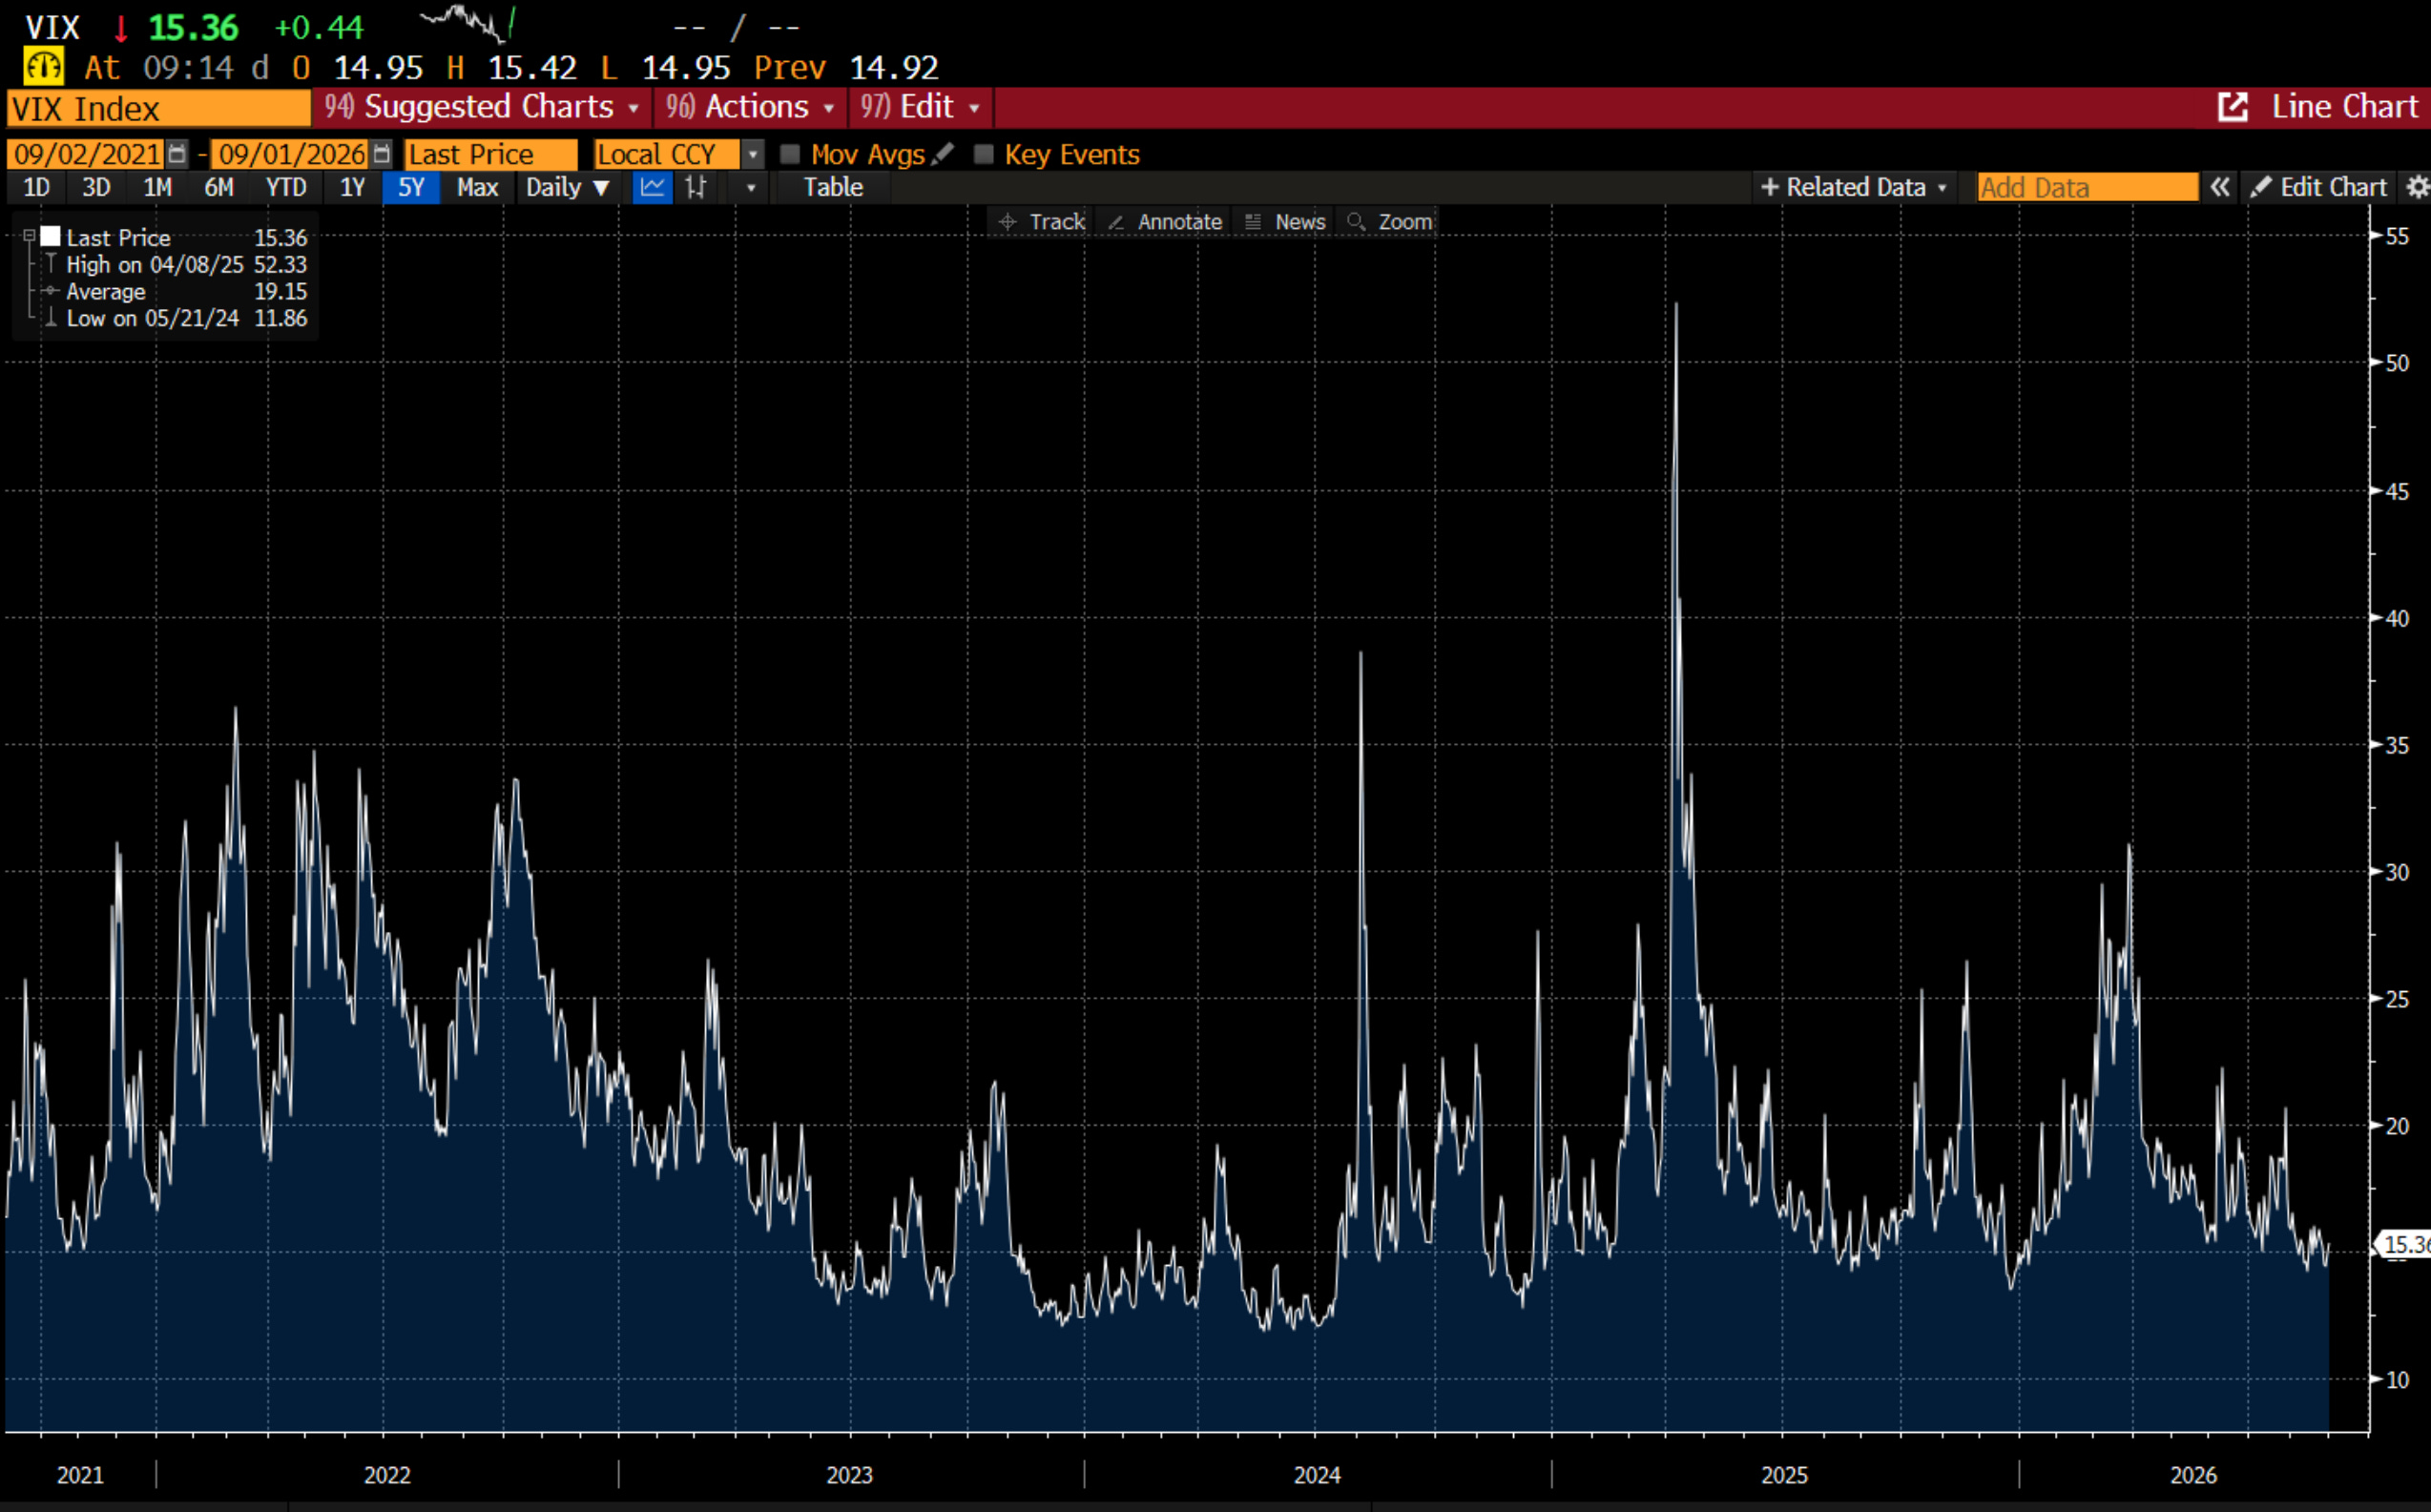
The funny thing is that it has been such a long bull market, and even though everything above is logical, even I am not sure equities can be weak. Time will tell.


