


The title of this substack - Capital Flows and Asset Markets - comes from what was a successful use of the idea that capital flows drives asset prices. Long time readers or followers of my work would have seen many charts that looked at Net International Investment Position (NIIP) to explain why China was a short from 2011 onwards, or why Yen used to rally. I stopped using NIIP because US NIIP in my mind signalled trouble in 2016, and yet here we are ten years later, and the US NIIP has continued to explode higher. When a model fails, I move on.
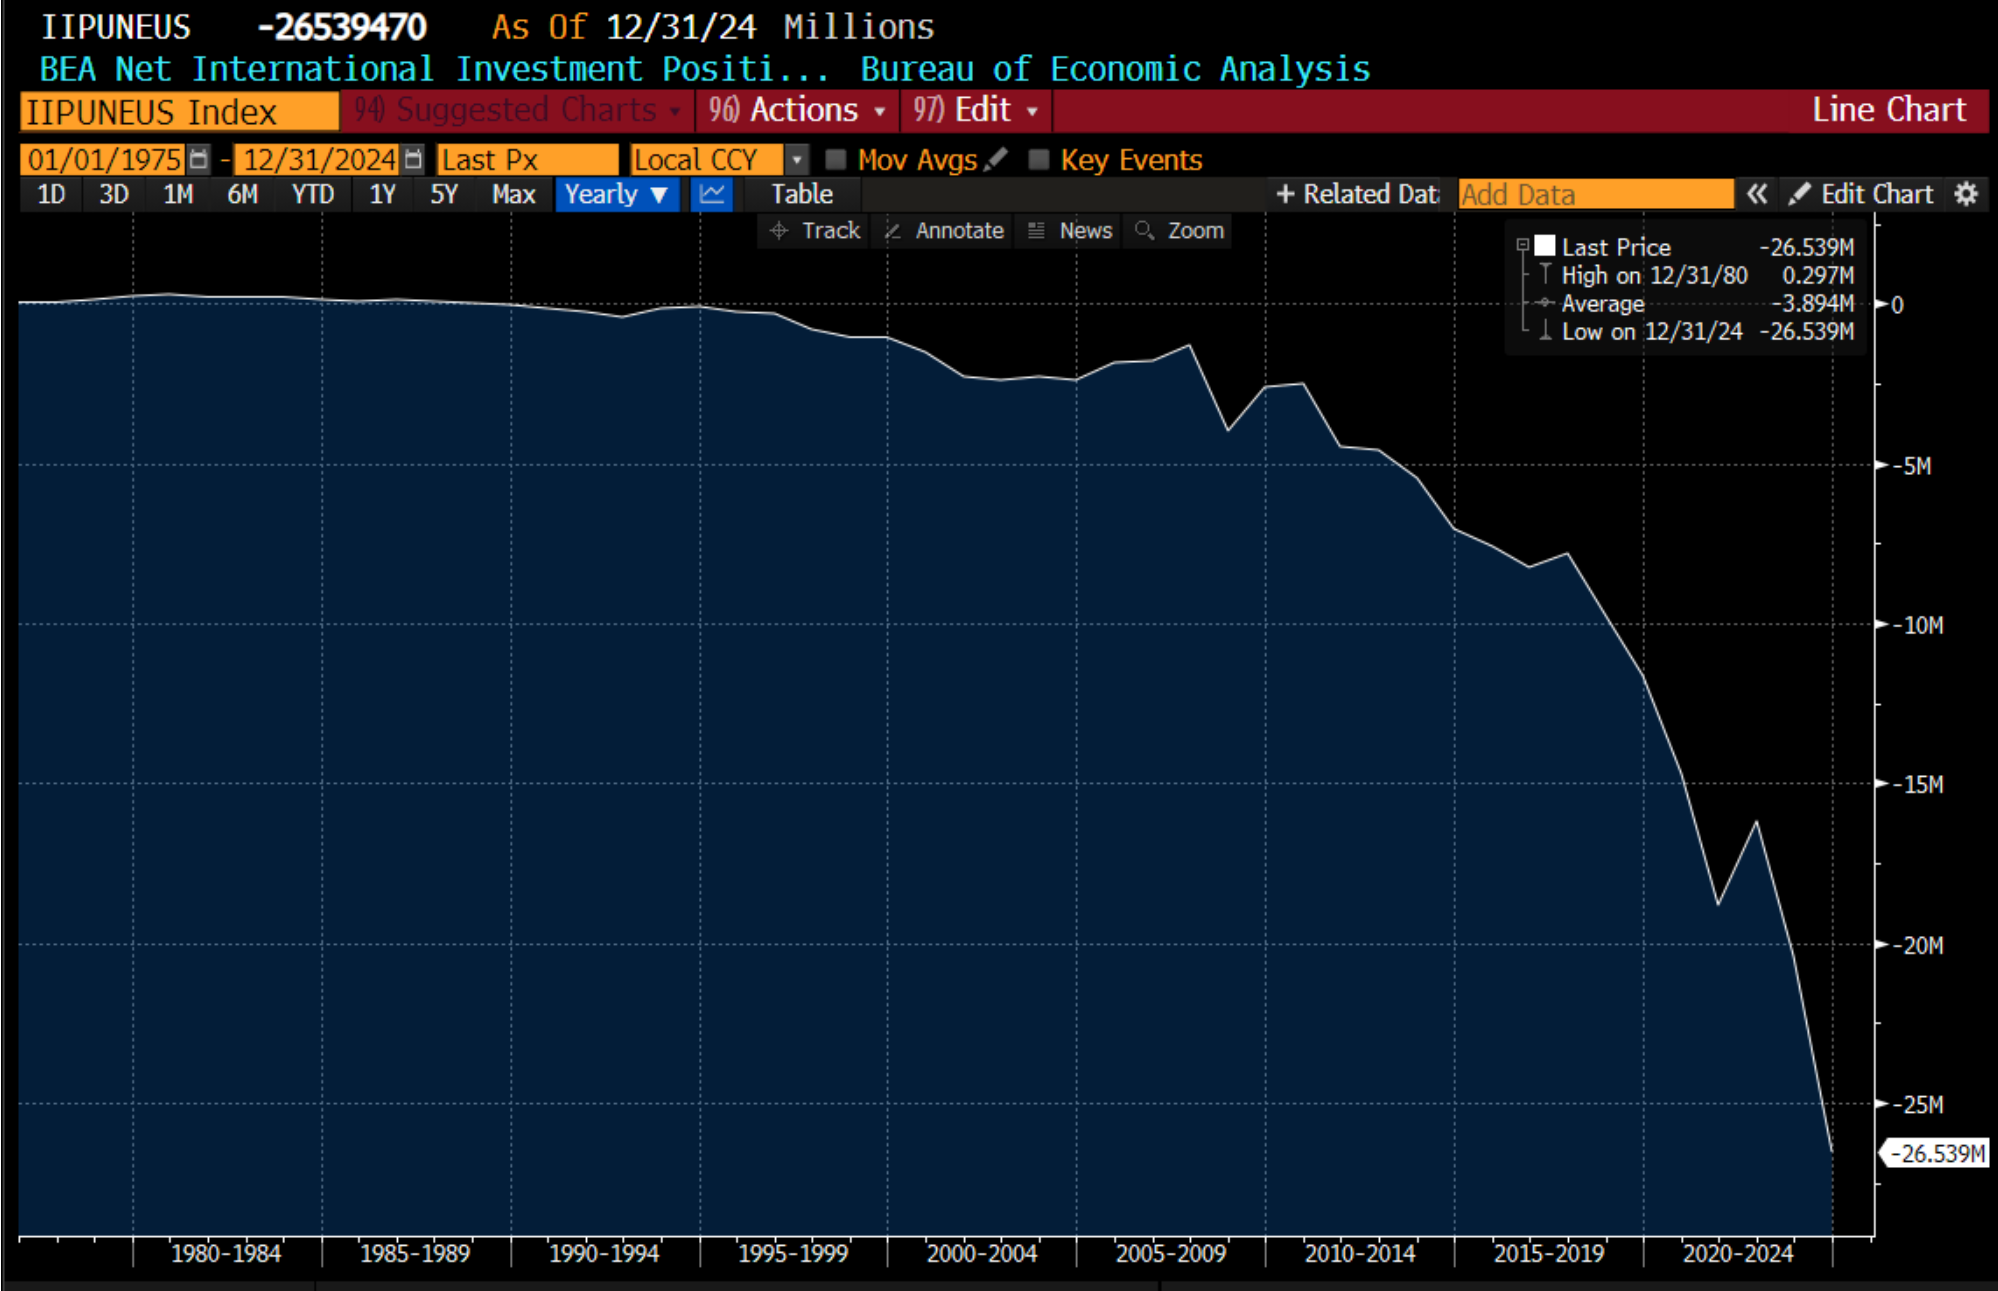
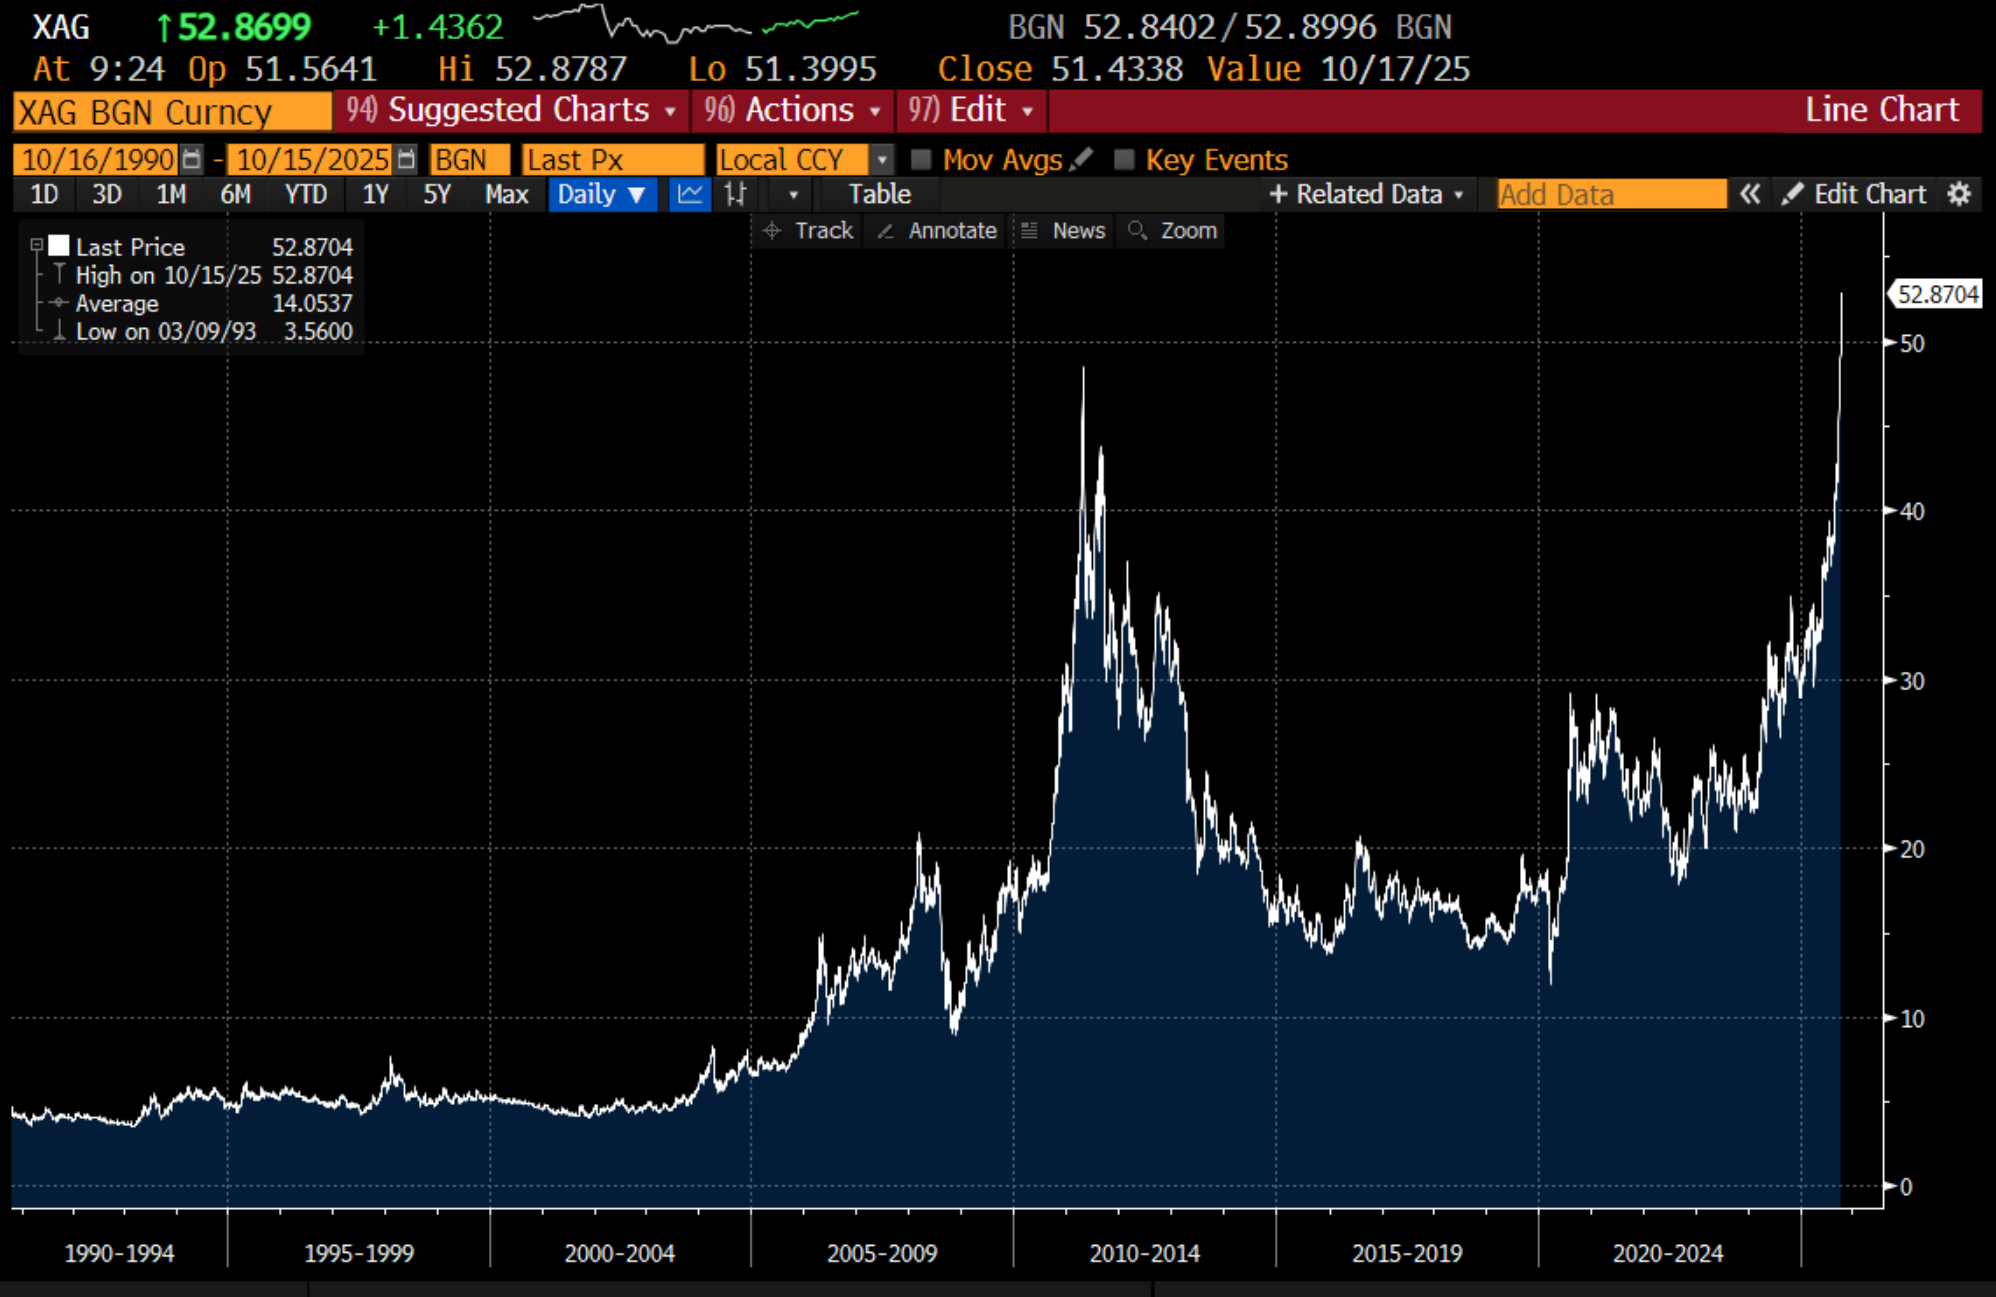
The debasement trade is now all the rage, with silver becoming the focal point. Using NIIP, I would have thought a debasement trade was ready to kick off in 2016 and I would have been too early. What has changed? For me, there is no real difference between US NIIP being negative USD 10 trillion, or USD 26 trillion. So why now?
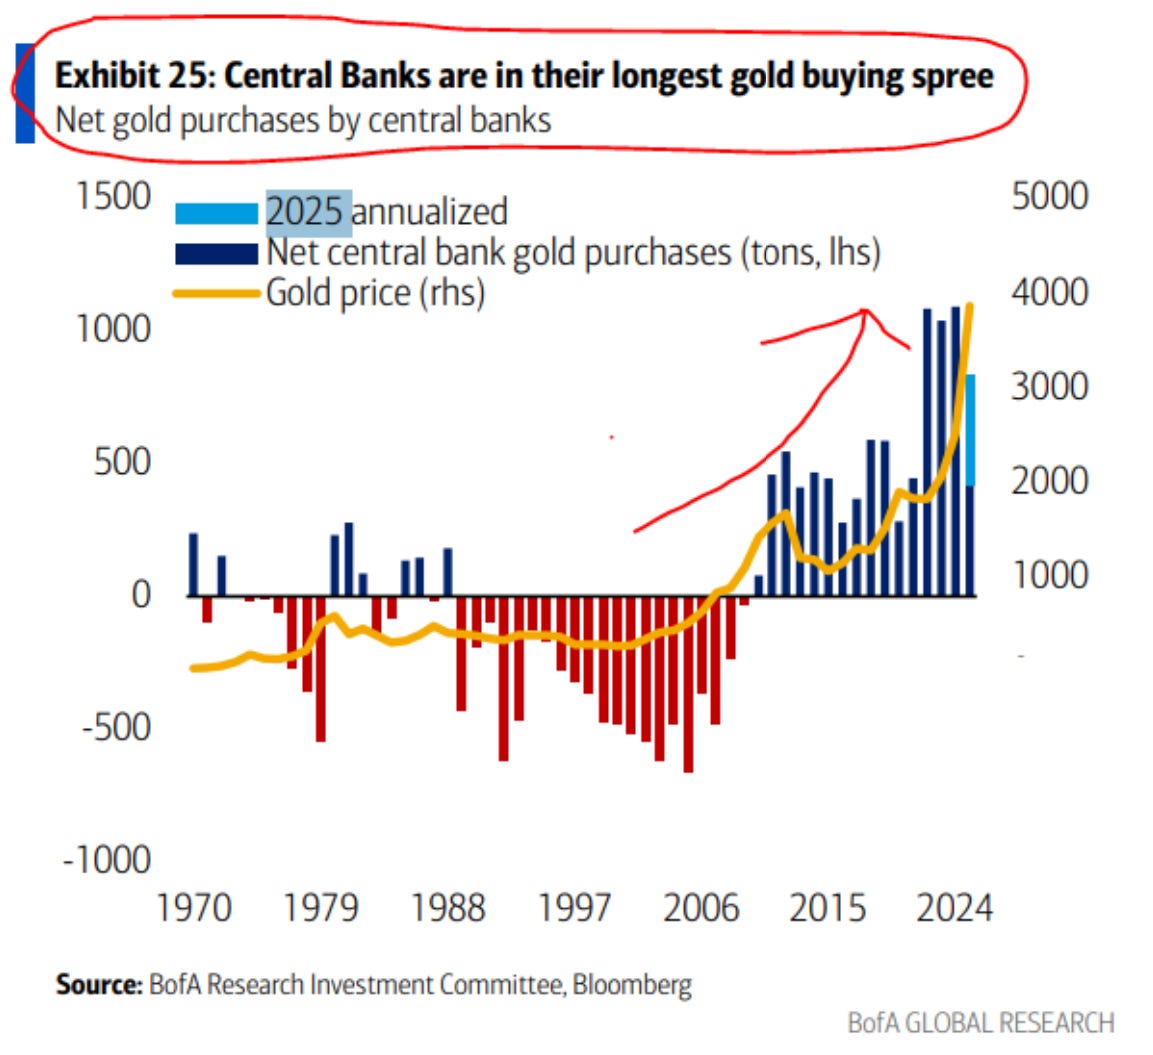
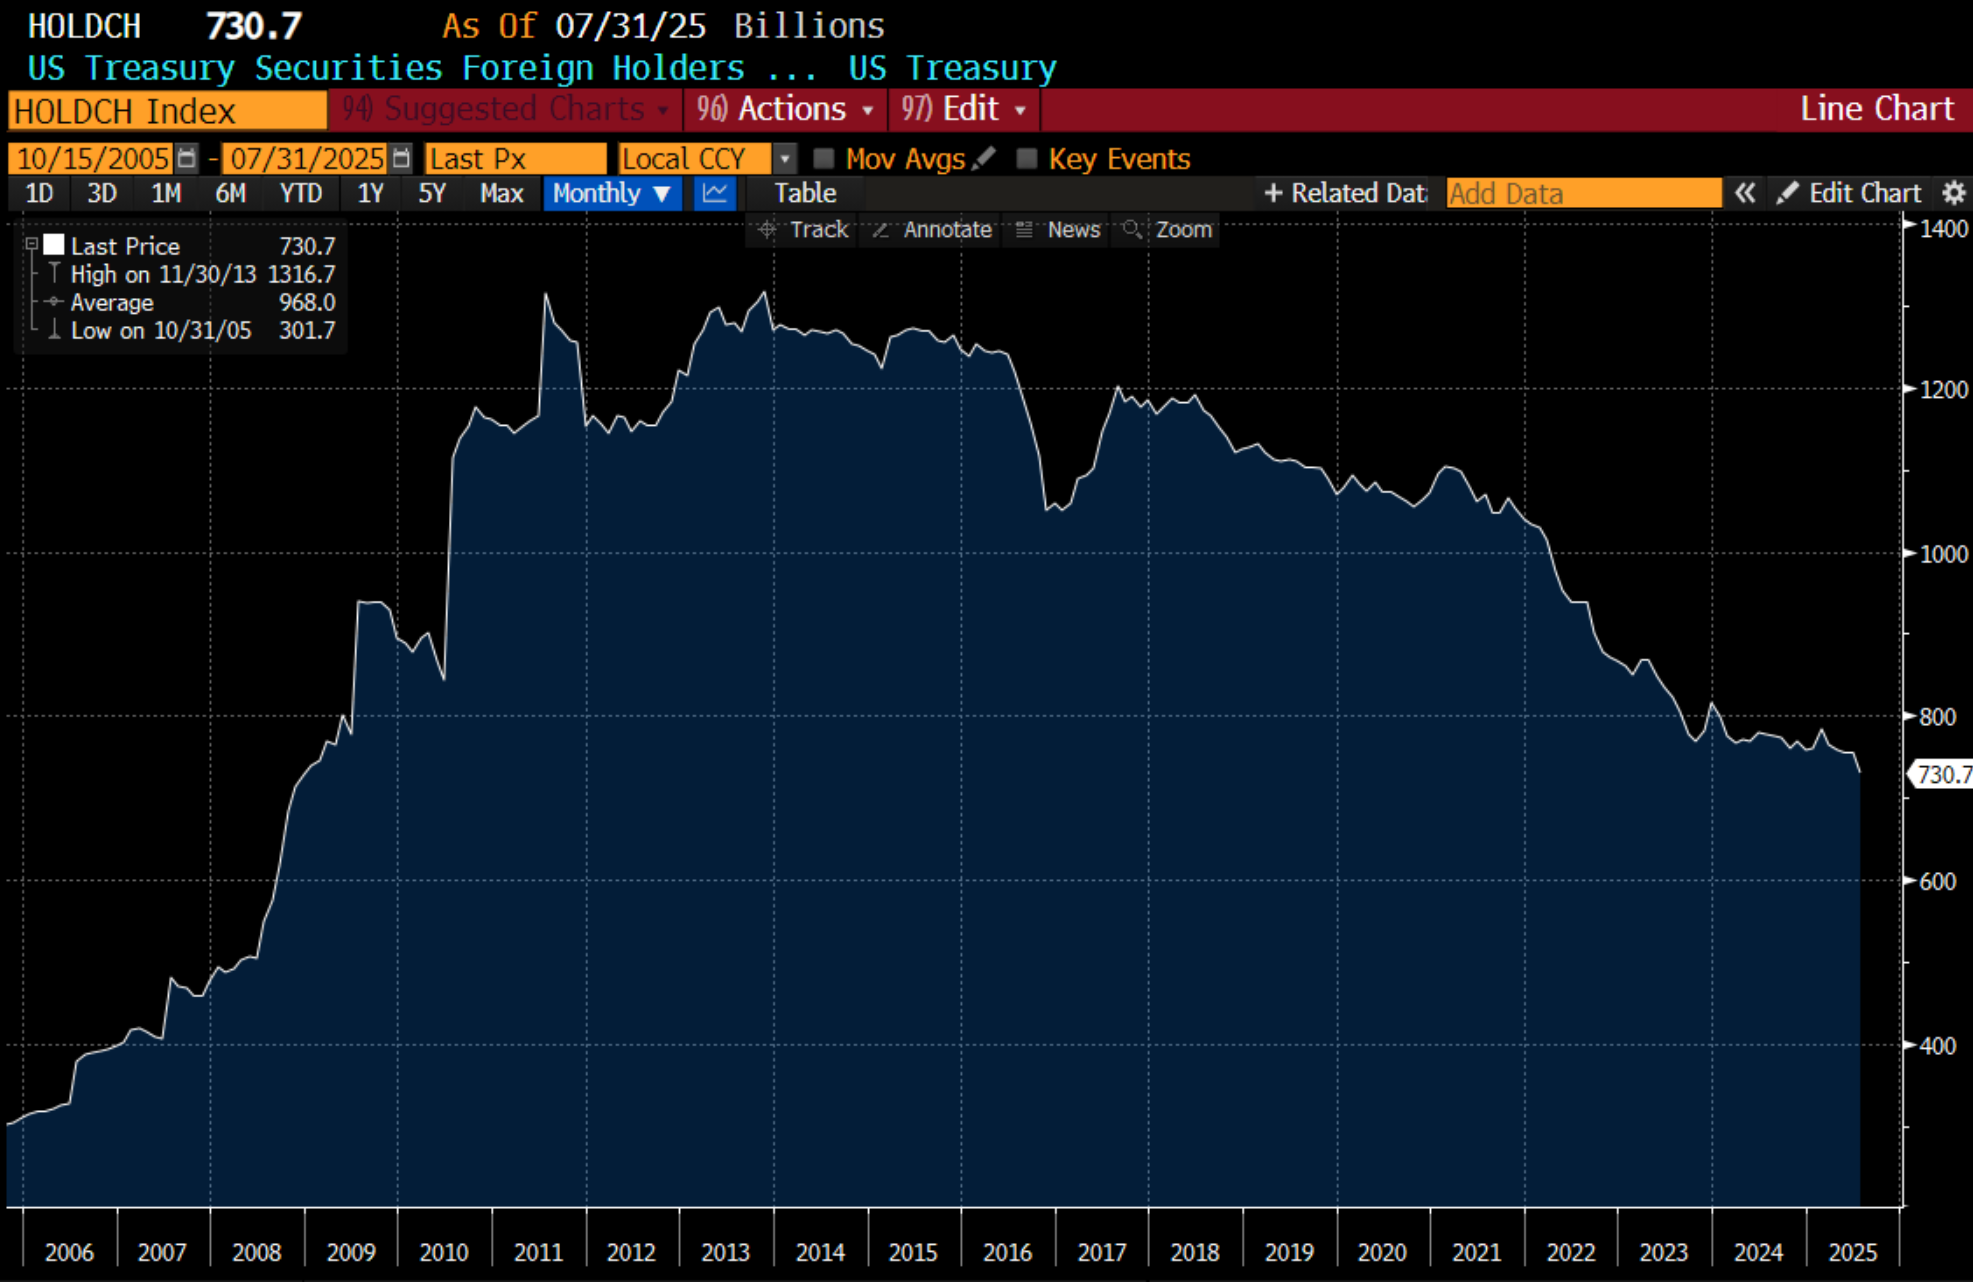
Long time readers will know that I have liked long Gold/short Treasuries for a while. The basic driver of that was that no central bank wants to hold treasuries anymore - which is more a political than macroeconomic argument. This has been borne out by the data.
And Chinese selling of treasuries.
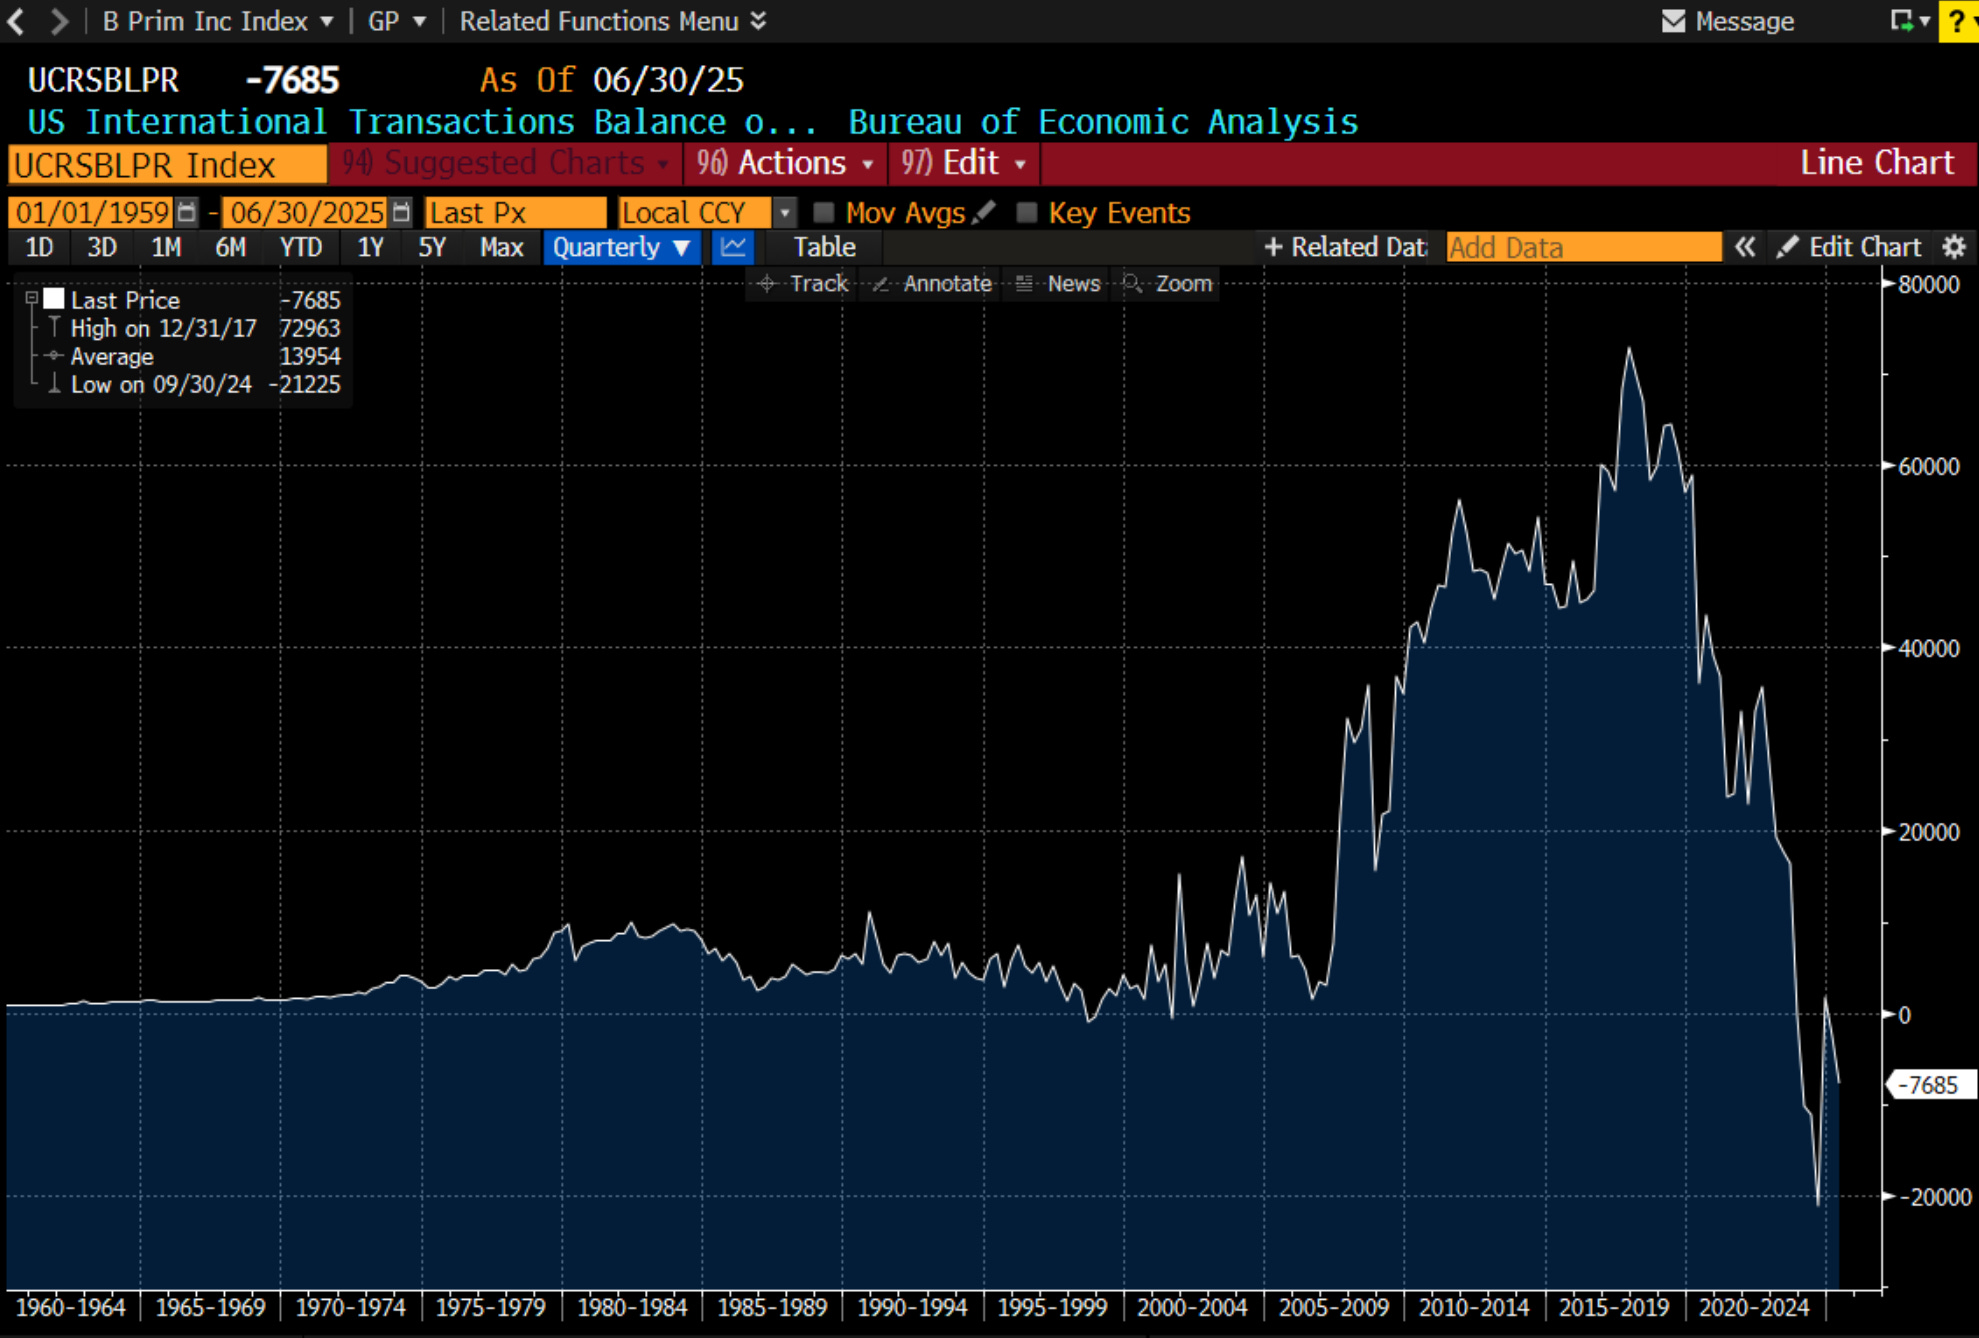
But I was reading some research from Marko Papic from BCA research, and he pointed out the US primary income has turned negative. I have looked at primary income before, but mainly from the point of view it was always positive for Japan, which drove a bullish Yen view (wrong!). Looking at the primary income data, I am stunned by how large the US promary surplus grew in 2016, and then how much it has fallen in recent years.
Marko has normalised this to GDP, which I could do but as I am a lazy bastard, I will just cut and paste his graph.
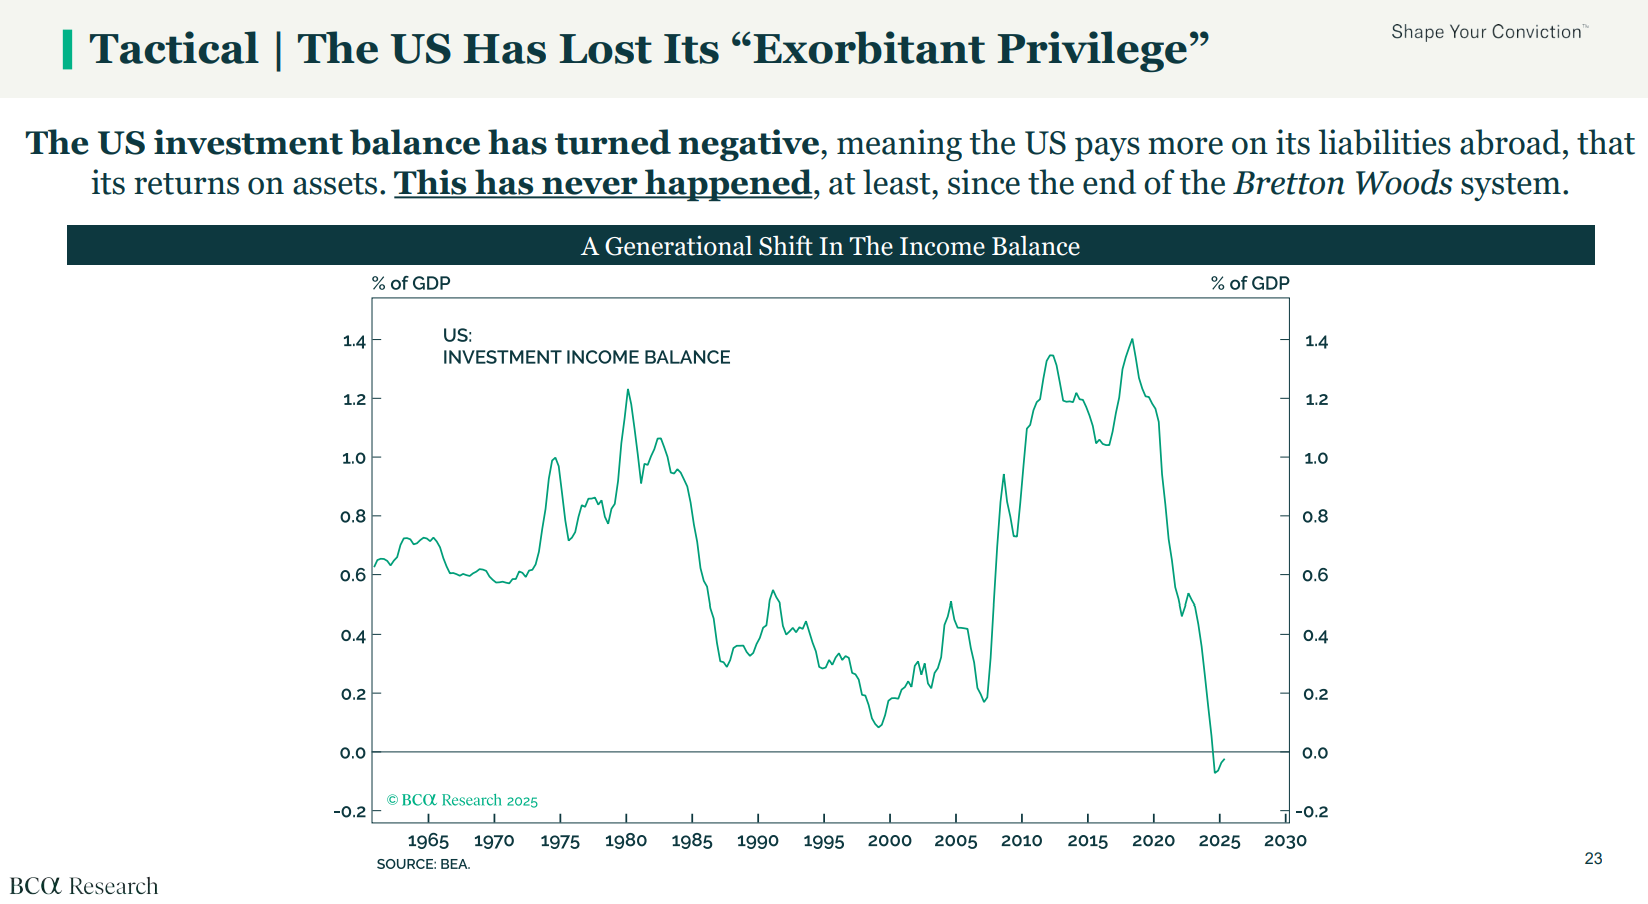
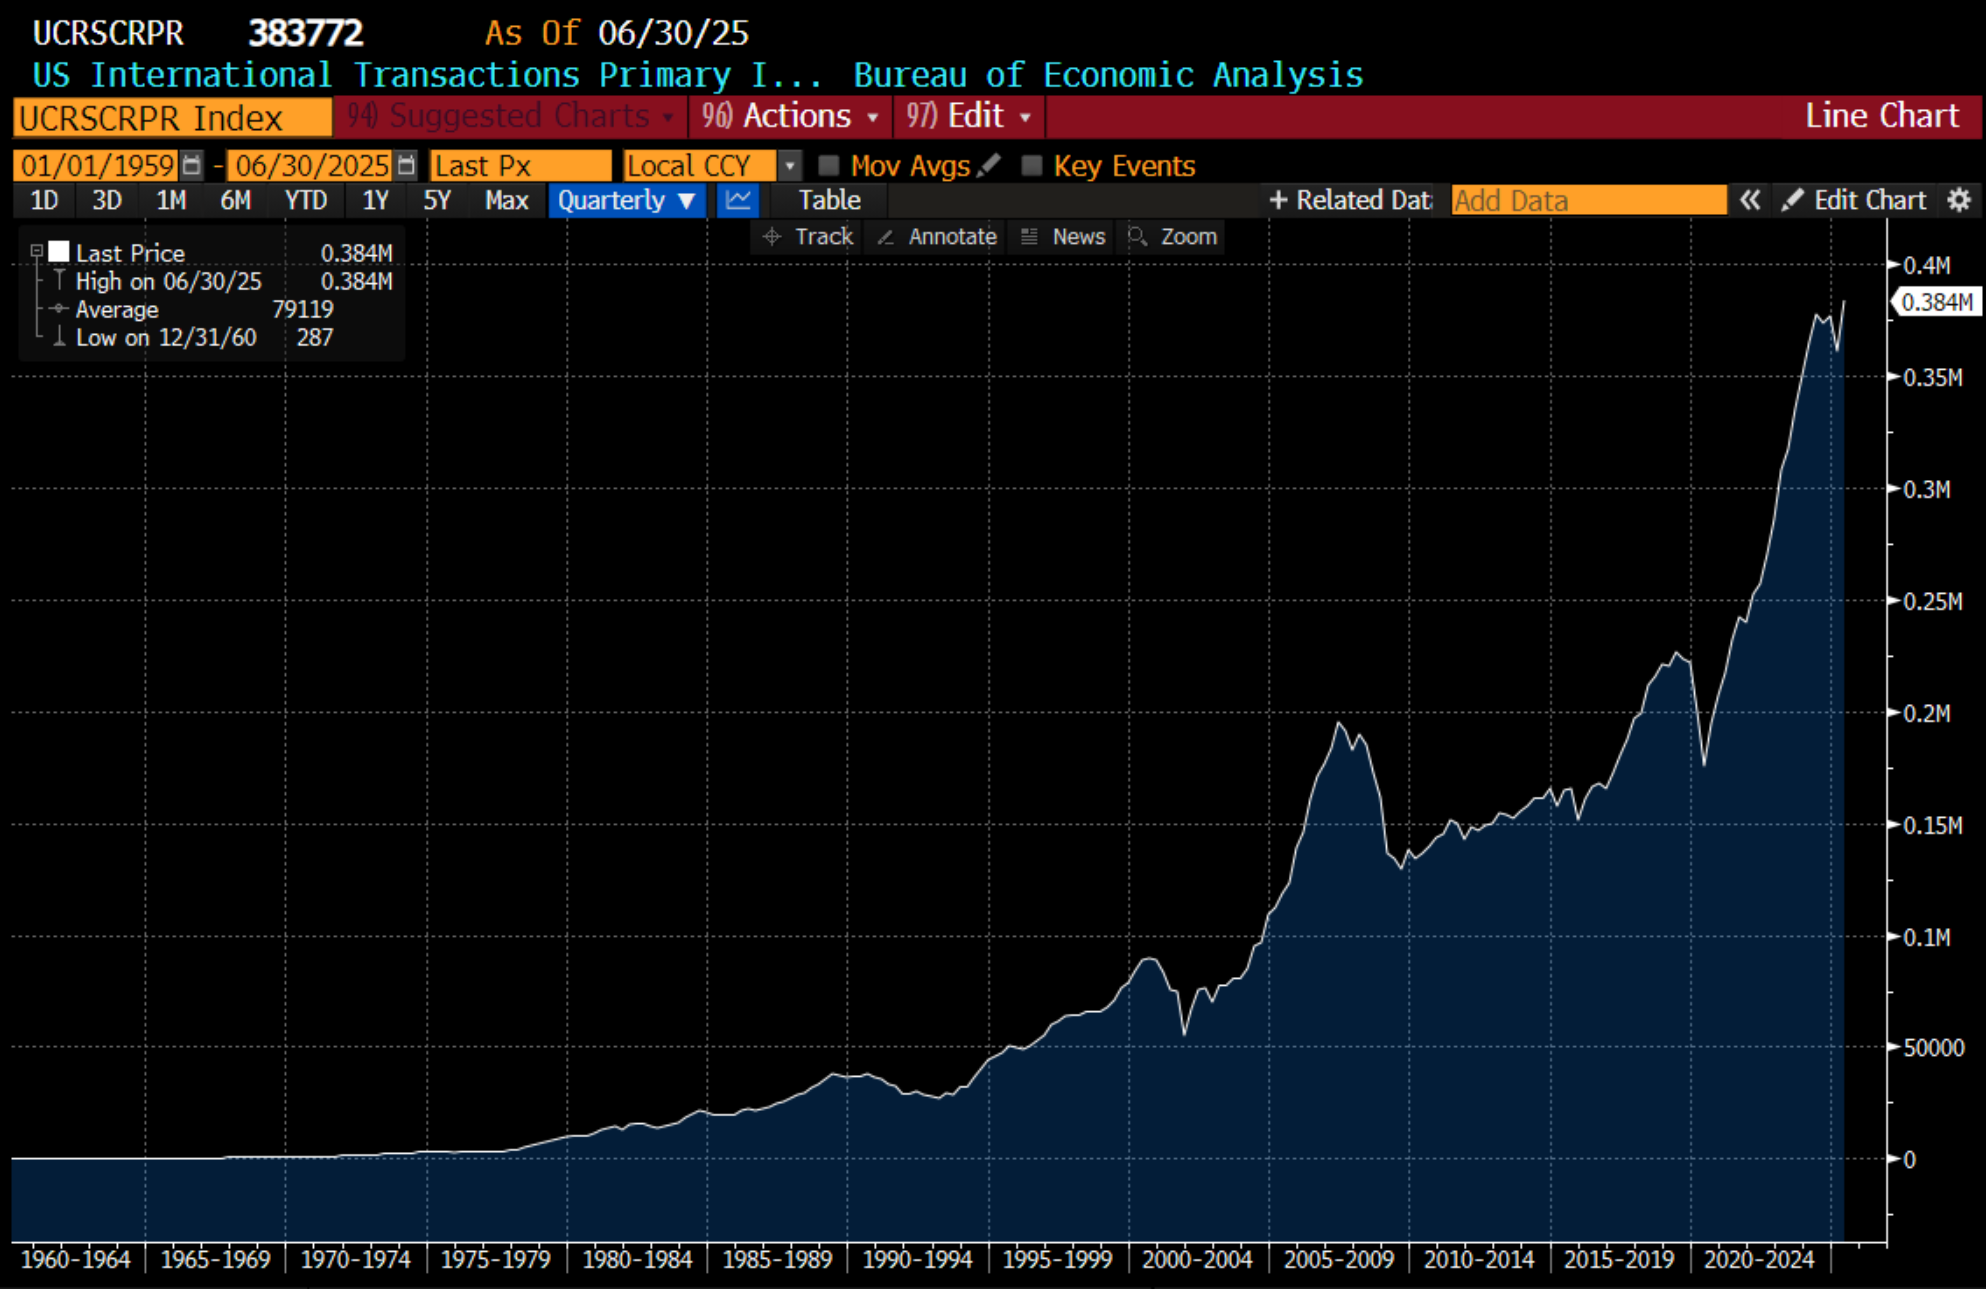
NIIP have become valuation driven. US NIIP is so negative, because US valuations are so high. But income is a cash driven number. It is not hard to work out why income balance has turned negative. Higher US interest rates means the US is paying much more to foreign treasury holders. If we just look at primary income payments, we can see that surge when the Fed raise rates in 2022 and 2004. This makes a lot of sense to me. In many emerging markets, raising interest rates often does nothing to defend the currency, as it just increase payments to foreigners outside of the county. It is only capital flow into assets that can turn a currency around.
Back in 2016, when I was looking at NIIP, and getting bearish US dollar and US assets, the primary income balance was a record surplus. Contrary to my view then, this would be bullish US assets in my view - and this has proven to be case. Also, if I was looking at the S&P 500 as a Japanese investor in 2016, I would think it was a no brainer to buy the S&P 500. It yield vastly more than the 10 year JGB.
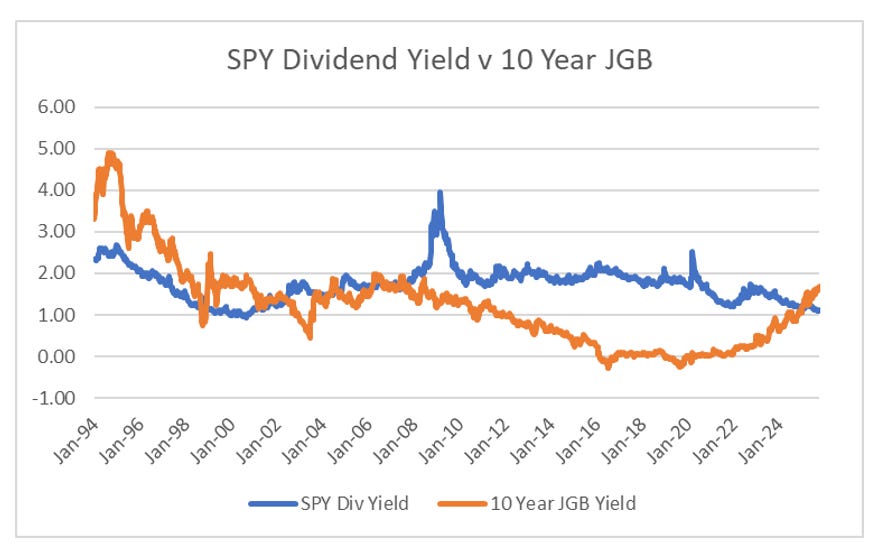
But for the Japanese investor today, the S&P 500 looks unattractive, and with a negative primary balance, US assets do not look great. So looking at this together the debasement trade looks pretty good. It implies that the US needs to cut interest rates and/or do yield curve control to get back to a primary surplus, which is bullish gold. Or if interest rates are not cut, then US equities look unattractive, which is bullish for gold. Looking at gold v S&P 500, we still have a long way to move.
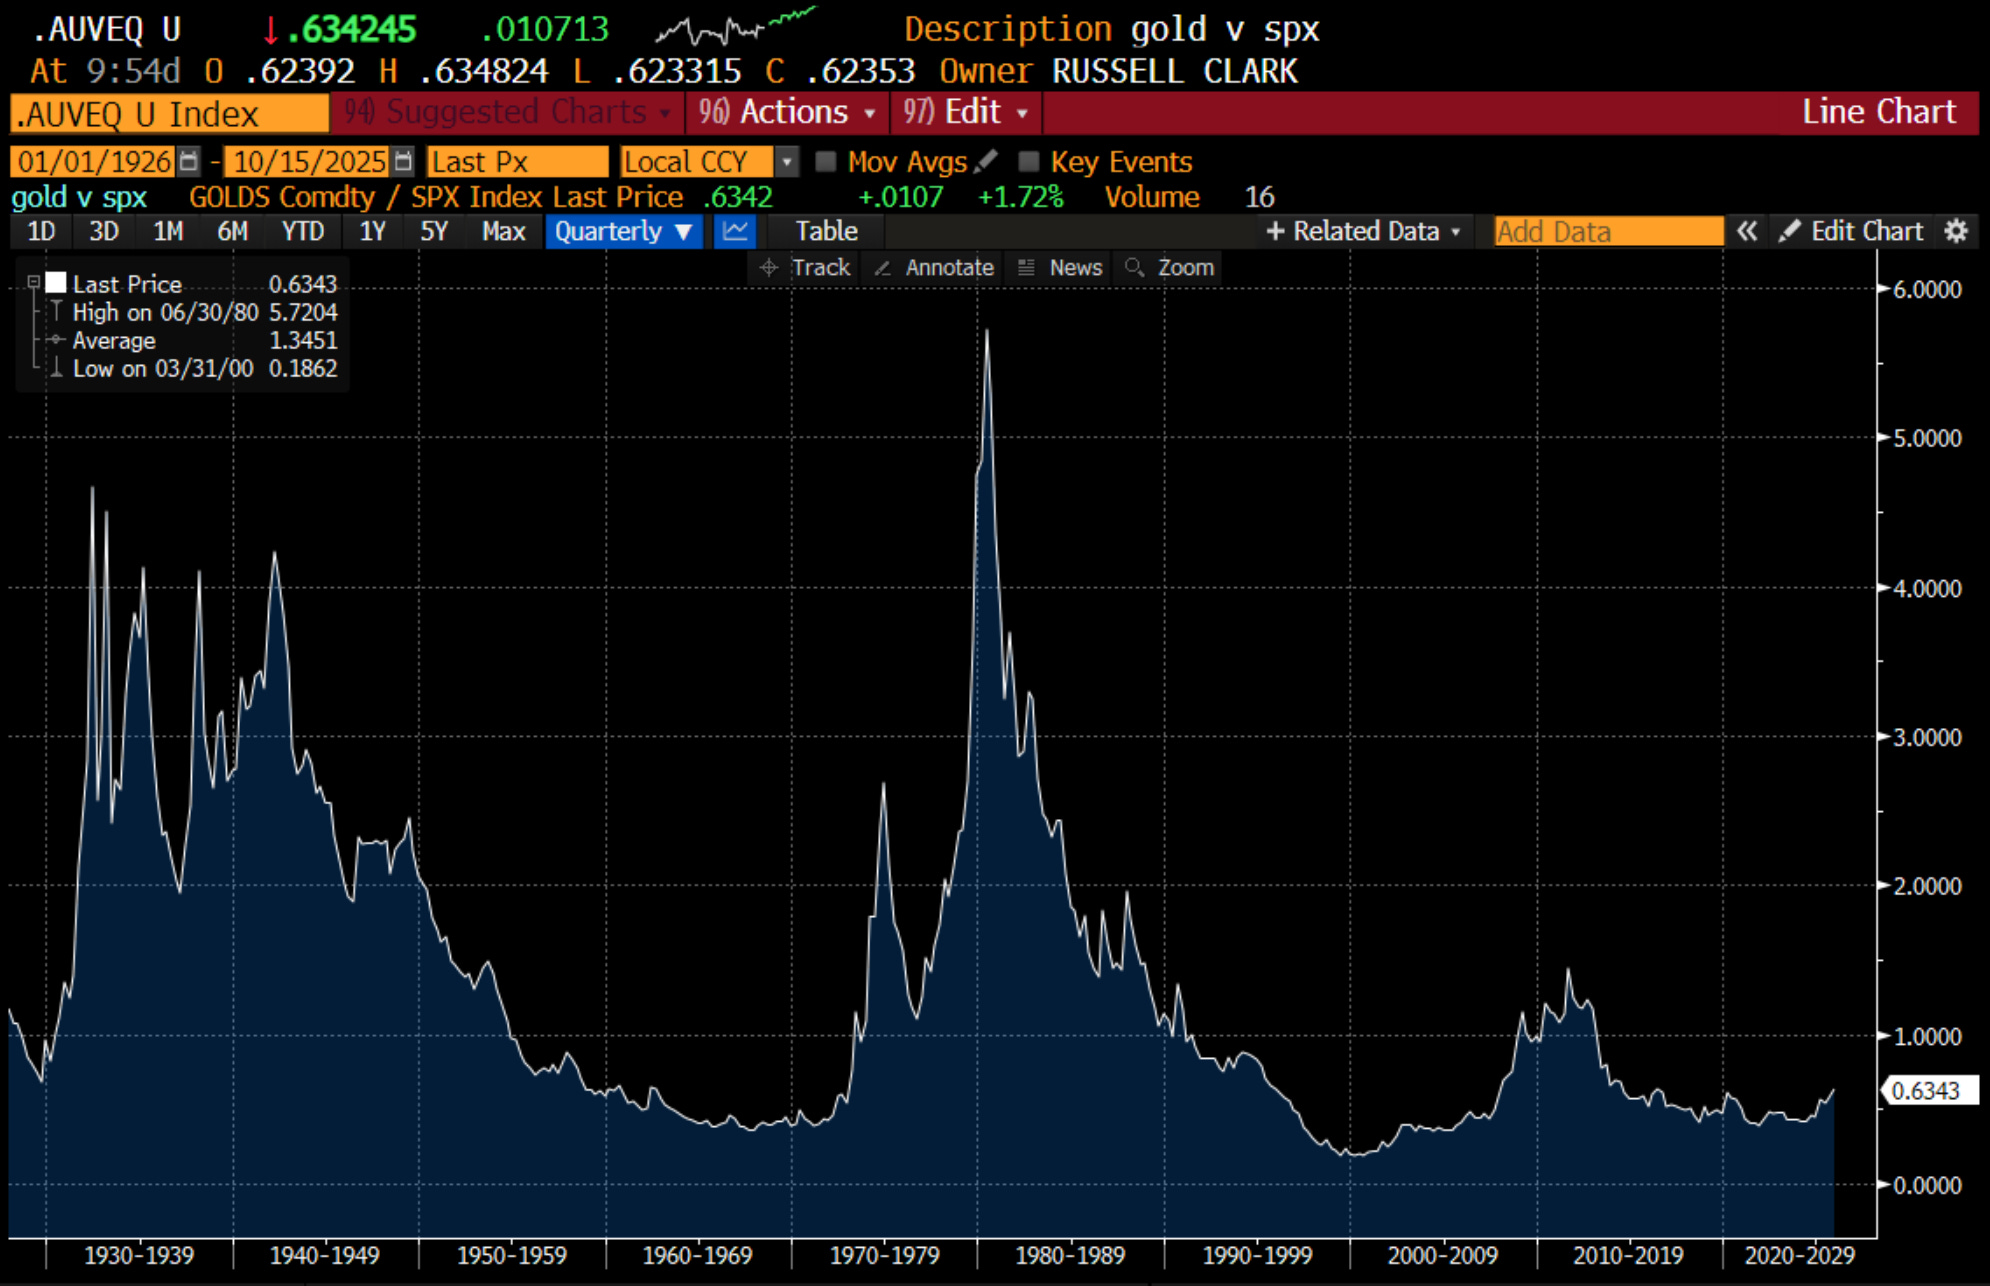
For gold bugs, or more sensible people like me that have been both long and short gold, the time to get worried seems to be when the US primary income surplus moves positive, as it did in 1980 and in 2011. We are a long way from there. Maybe I need to buy more gold?
