

I had been taught that when you see gold starting to outperform the S&P 500, then something is going wrong. In 2025, gold surged against the S&P 500, but in 2026, it has given most of that back, and gold has entered a bear market.
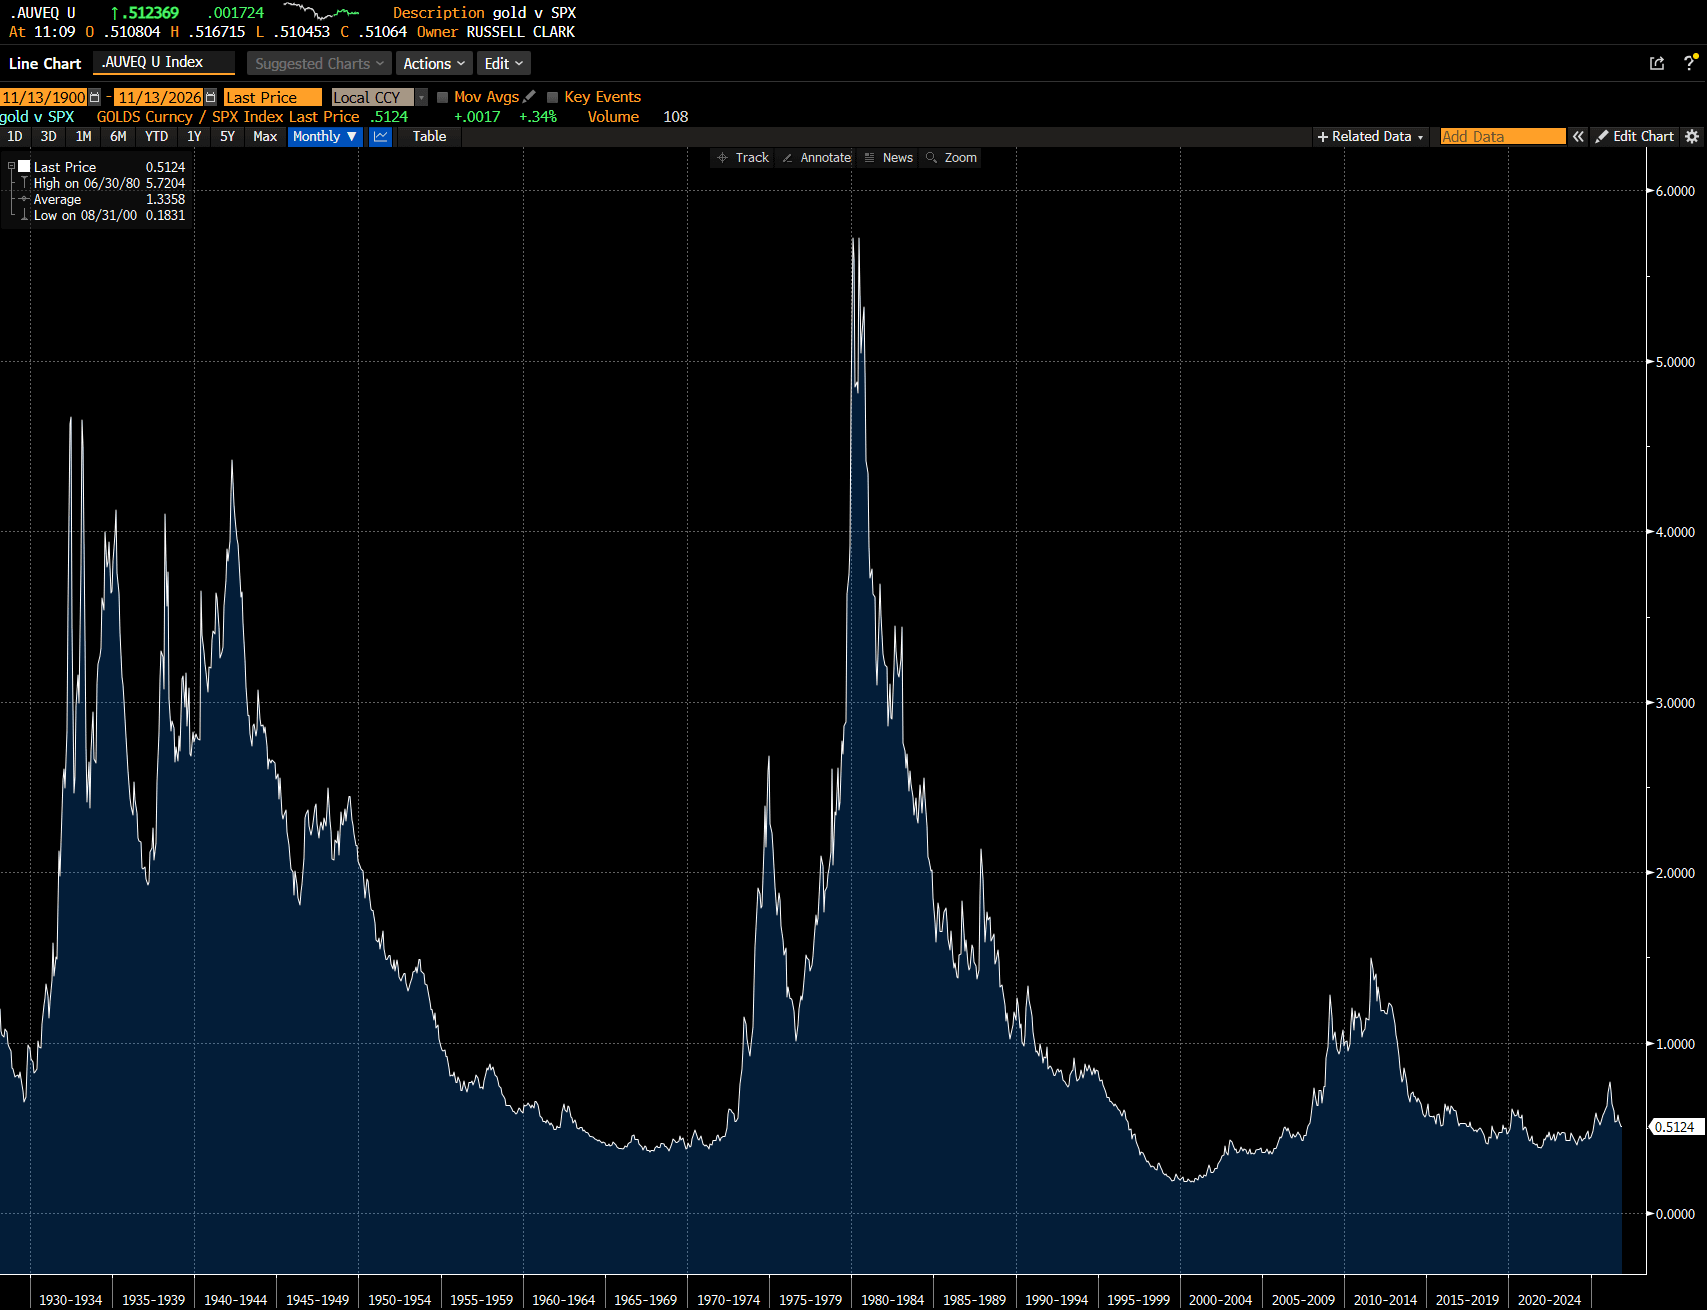
In early 2025, during the Liberation Day Tariff sell off, we saw gold surge and treasuries weaken, which for me was a sign of the rest of the world giving up on Treasuries, which should have negative consequences for US assets. That was the theory anyway.
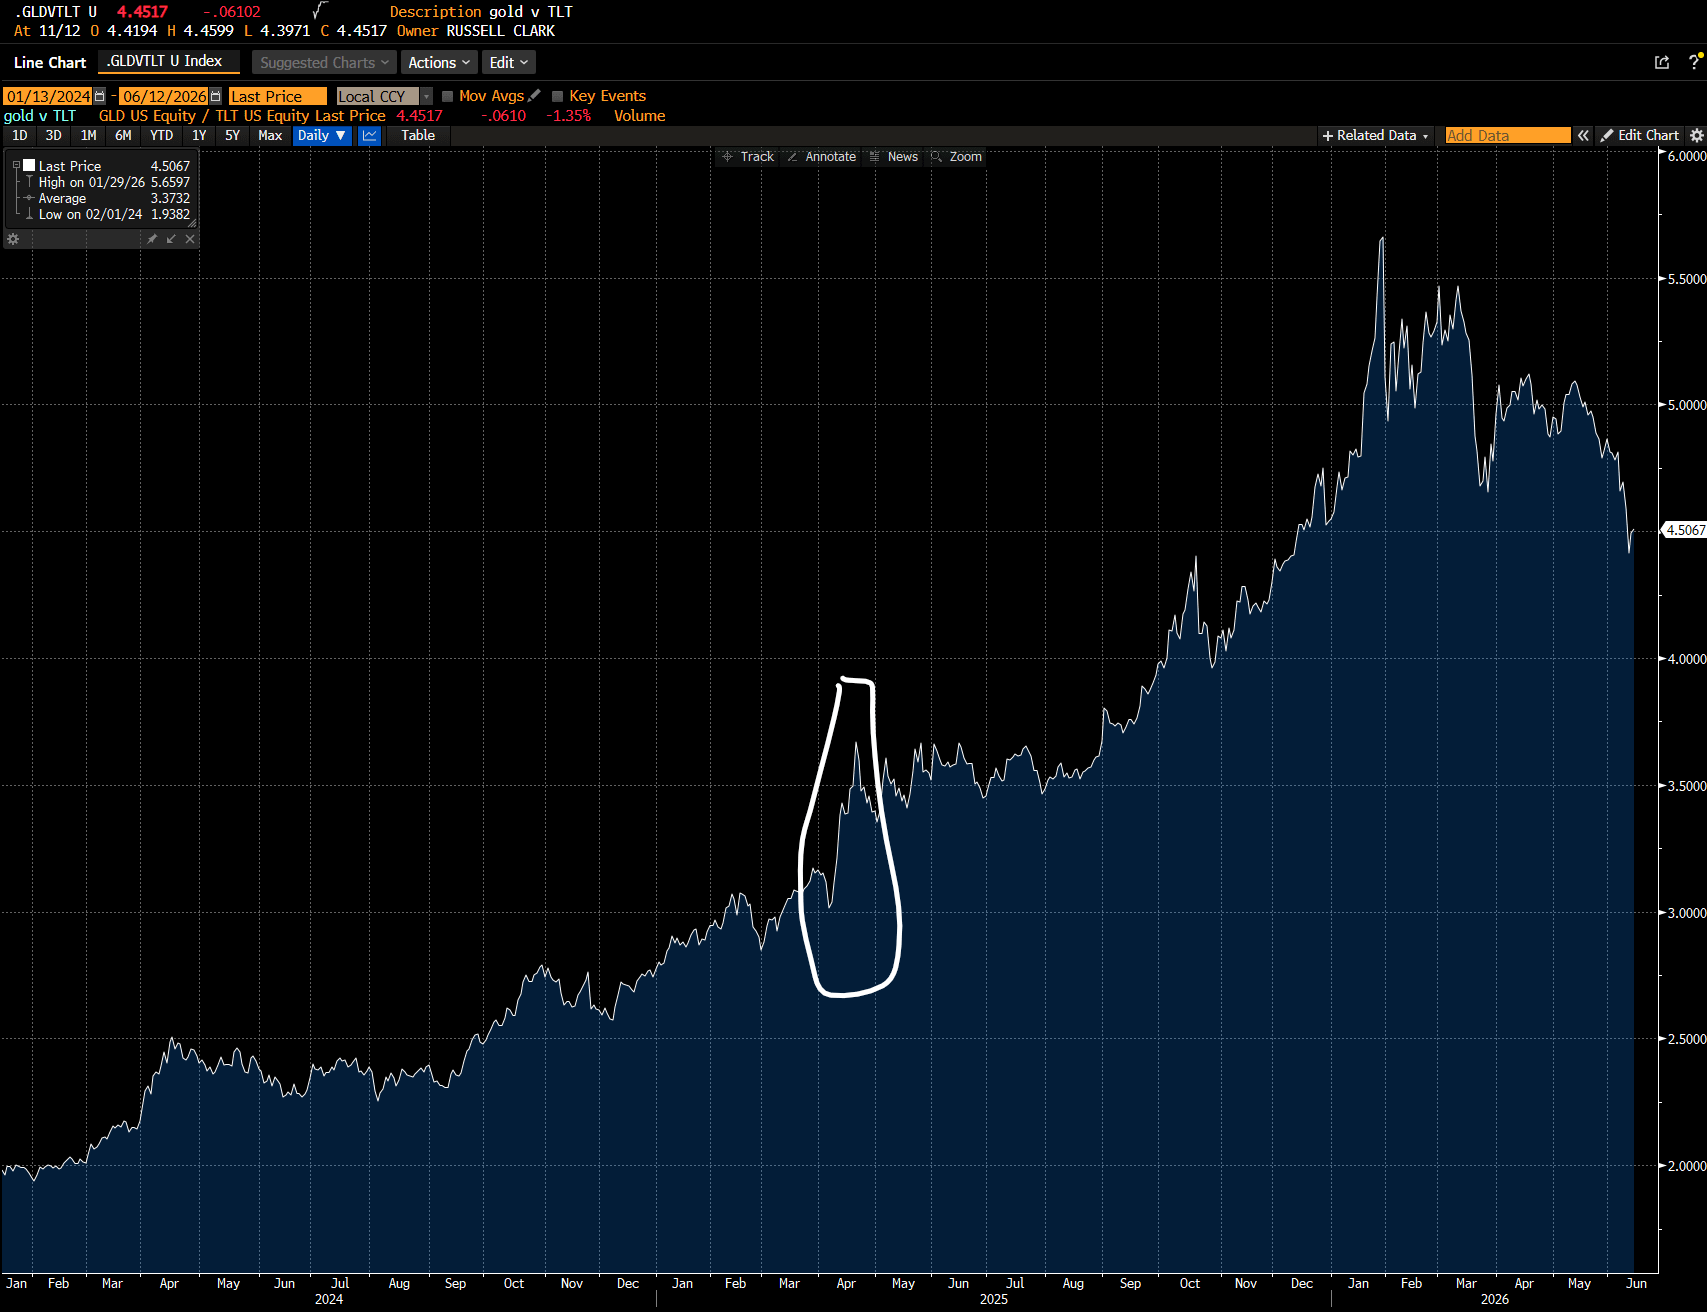
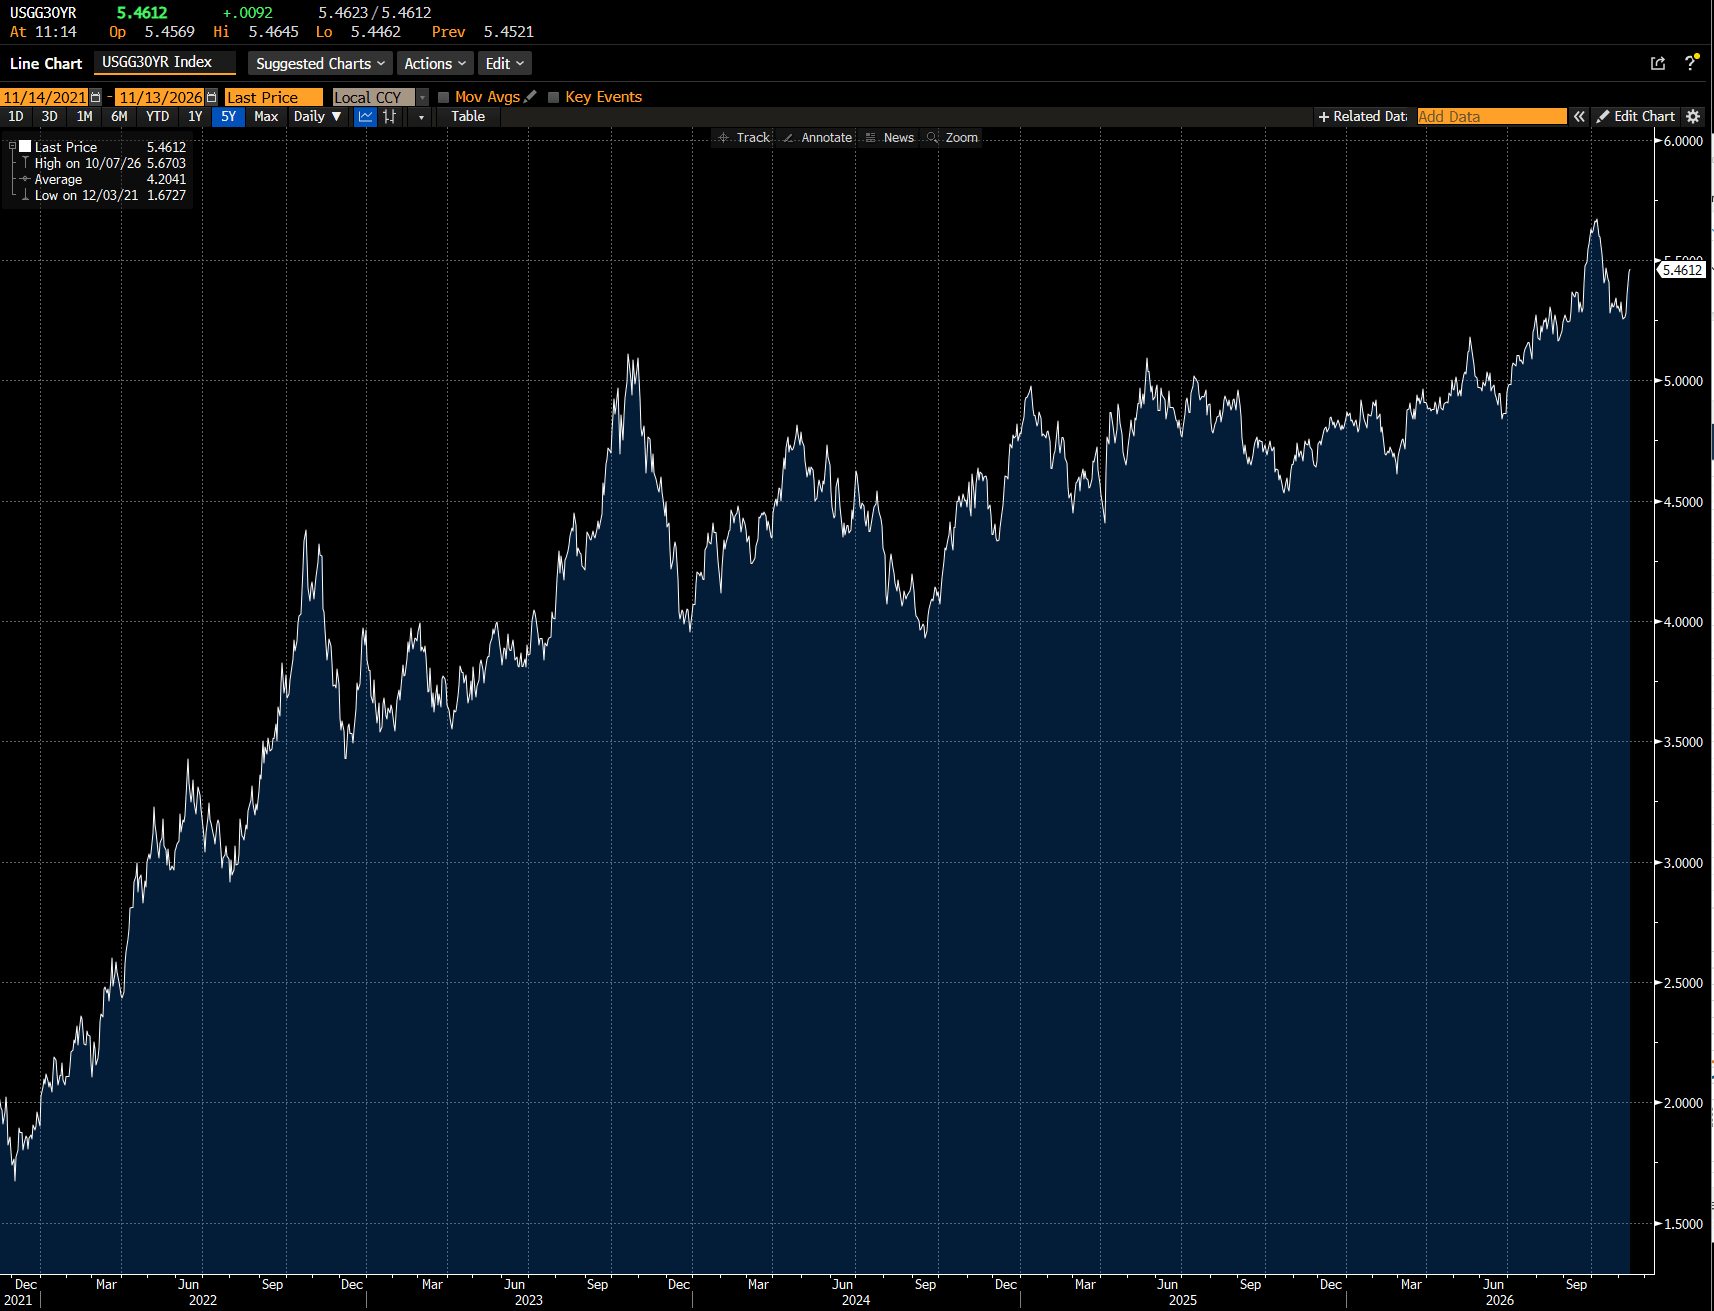
But this year, gold has been weak, and the S&P strong, even as yields have risen. The opposite of the theory. Dollar has also strengthened. That is gold spike did not signal the movement out of US assets.
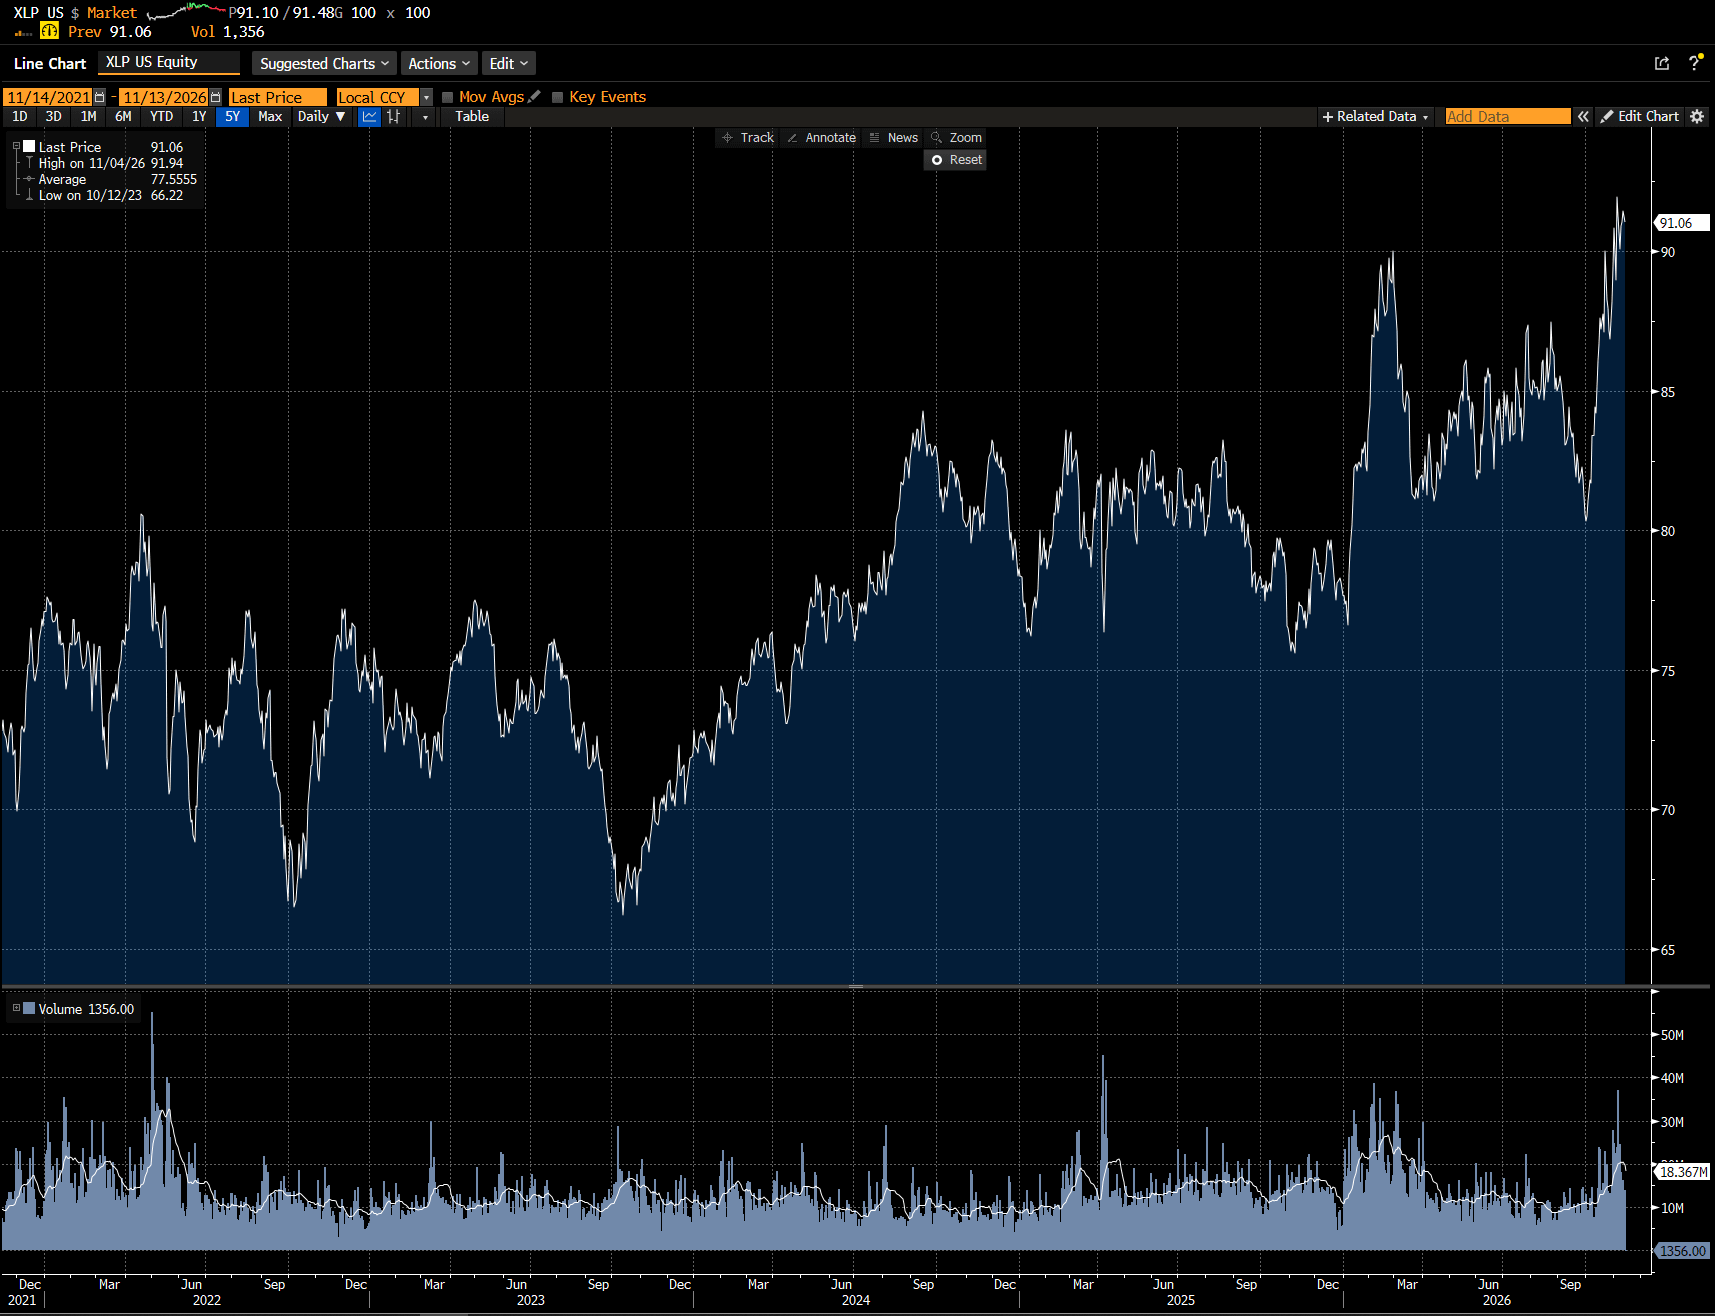
Also, another oddity is that in the US, defensive stocks such as staples have done well, even as yields have risen. Again the opposite of what you are taught in financial analysis.
Adding to the mystery, KDP High Yield has risen substantially this year, which is normally a headwind to markets. You would expect equity weakness. This was the case in 2022, but not in 2026.
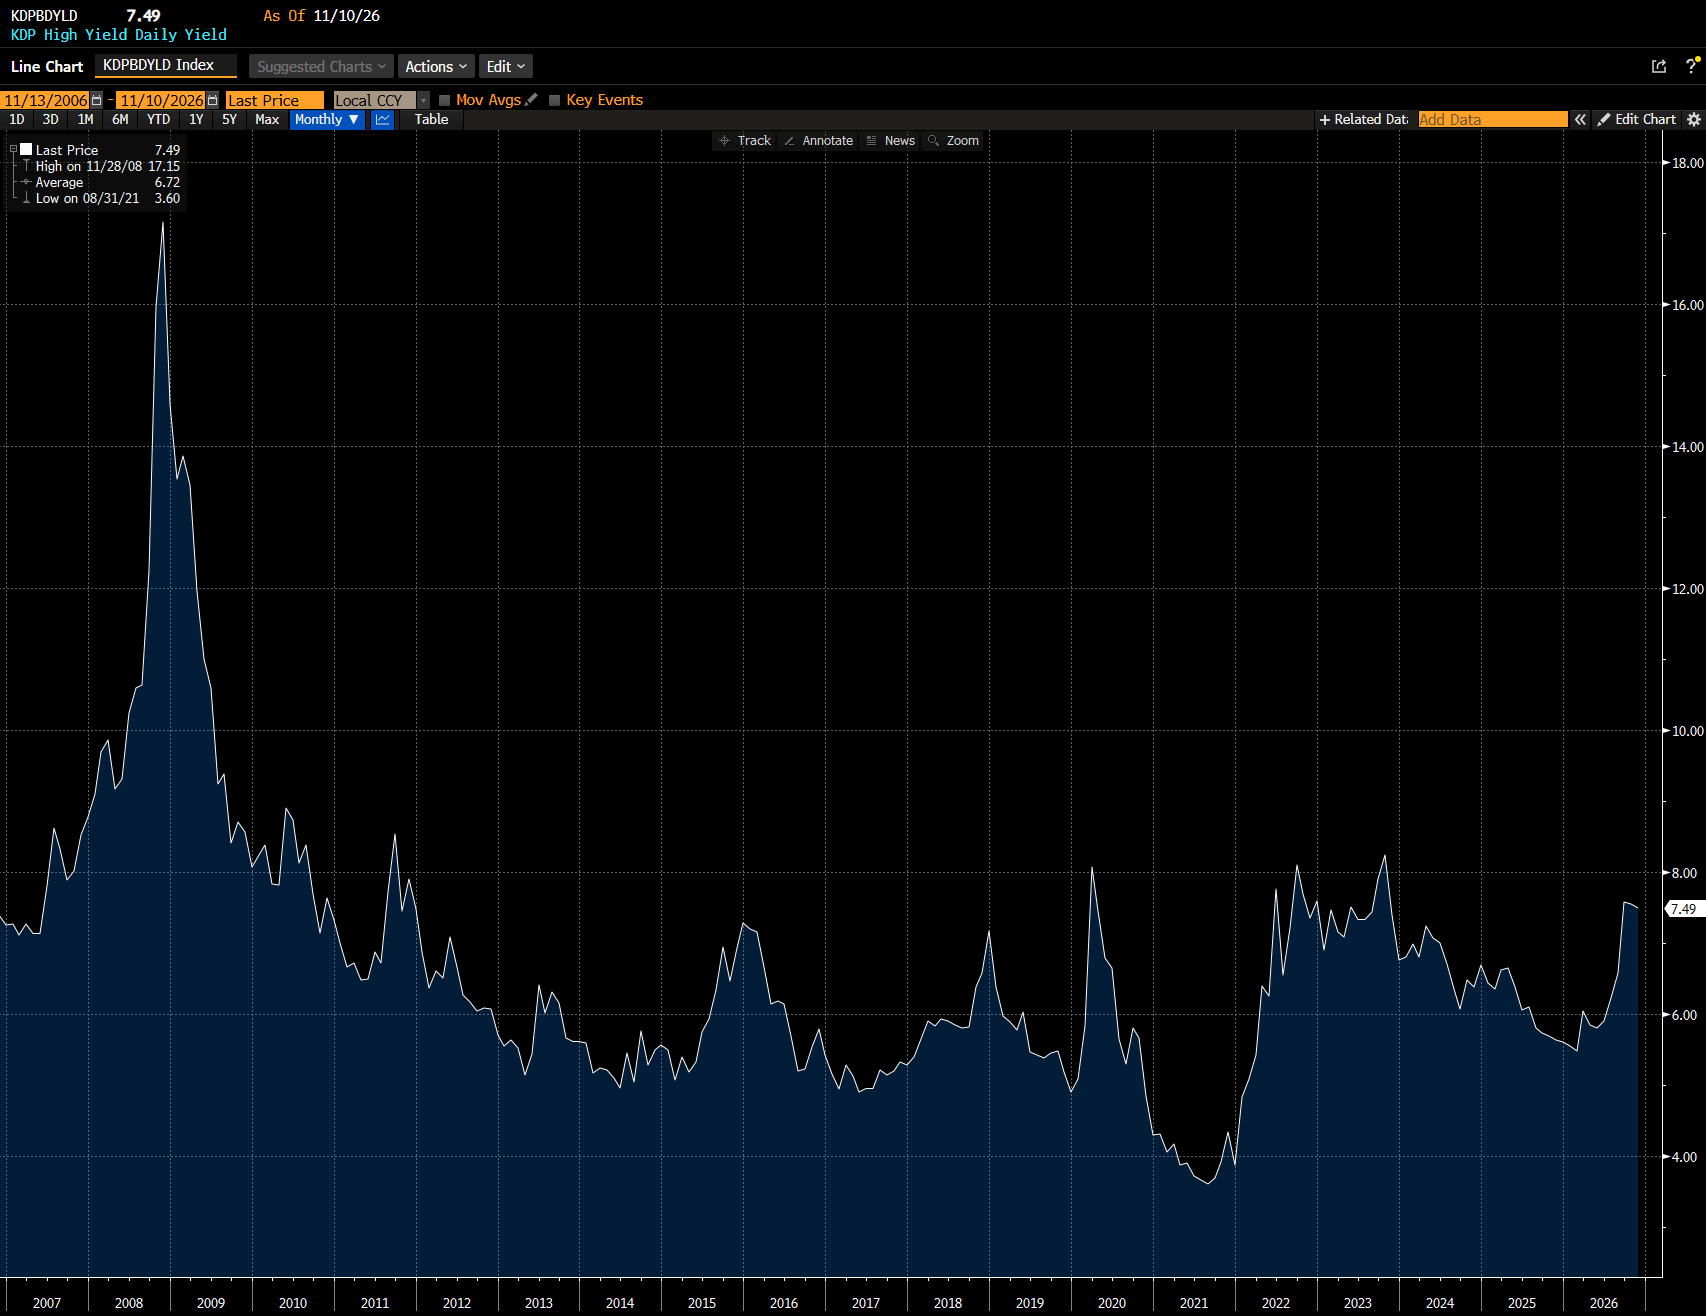
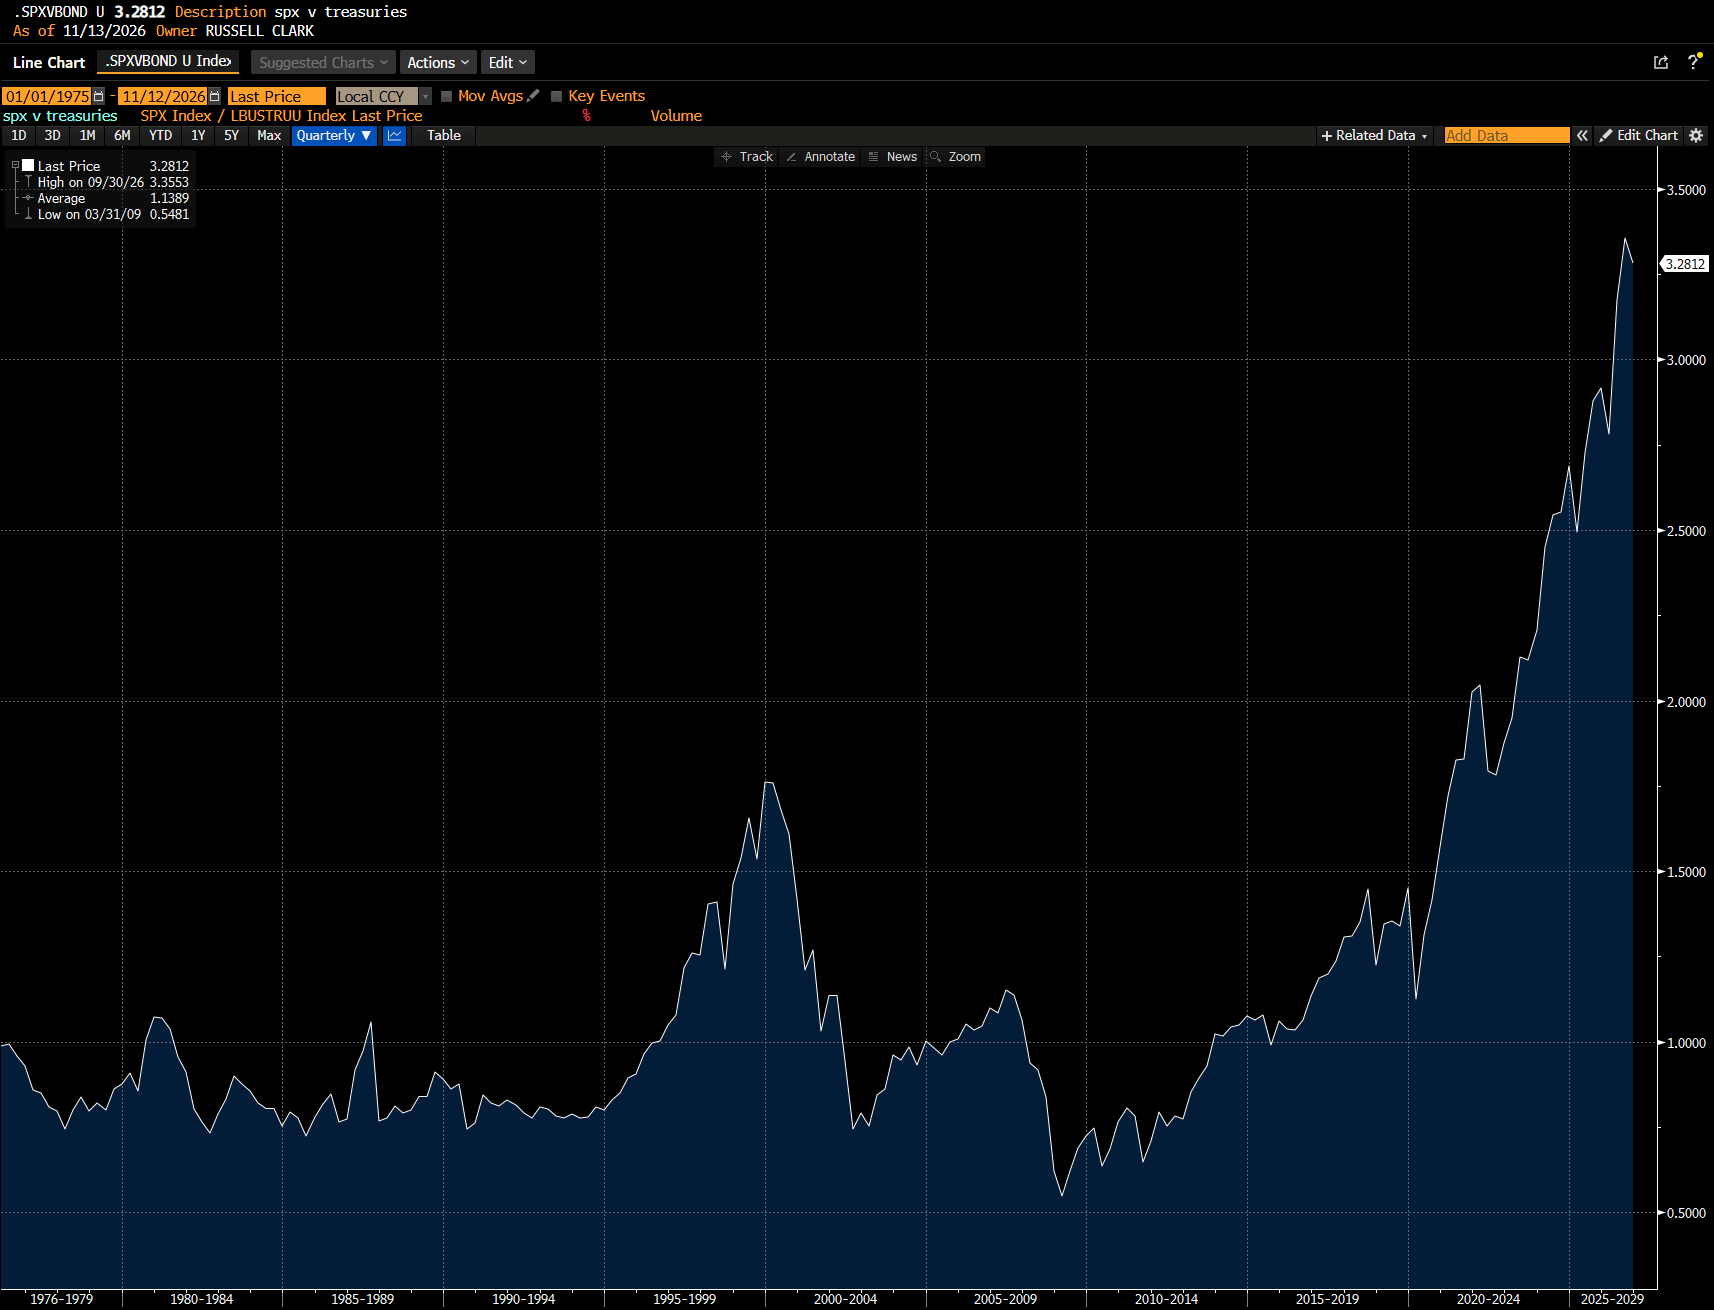
Basically every macro model you could come up with for markets has failed in 2026. I also wondered about the phenomenal performance of long SPX and short TLT. Historically this has been mean reverting, but not anymore. Does this provide a clue to what is going on?
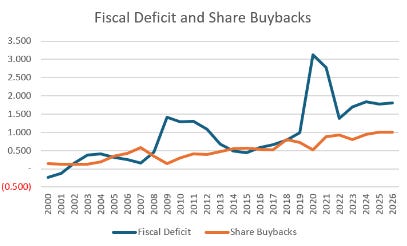
I have started to look more closely at share buybacks. They have become much more common since 2000, and there does seem to be a relationship between share buybacks and deficits. Or in other words, the fiscal deficit it returned to share holders via buybacks. Bigger deficit, bigger buybacks?
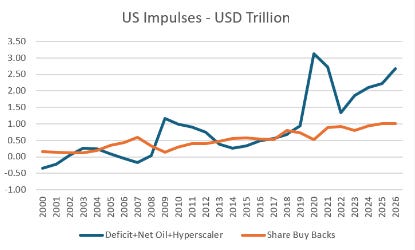
But I thought this model a bit simple, as it does skip the impulse from housing, which was negative for the US from 2007 to say 2012, and also missed changing dynamics in the oil market. These days, a rising oil price is neutral on the US. I tried to model for that, and also hyperscaler spend, to get a total impulse for the US. You end up with a massive impulse, and inline with the Biden era Covid push. No wonder yields are going up. Also the US turning oil exporter removes the natural leakage of the US dollar to other markets.
For comparison, I have added in China, and also modelled for net oil spend.
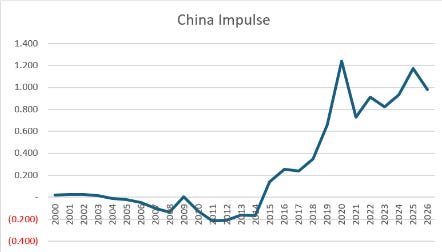
This has a passing resemblance to the main China equity index, the CSI 300.
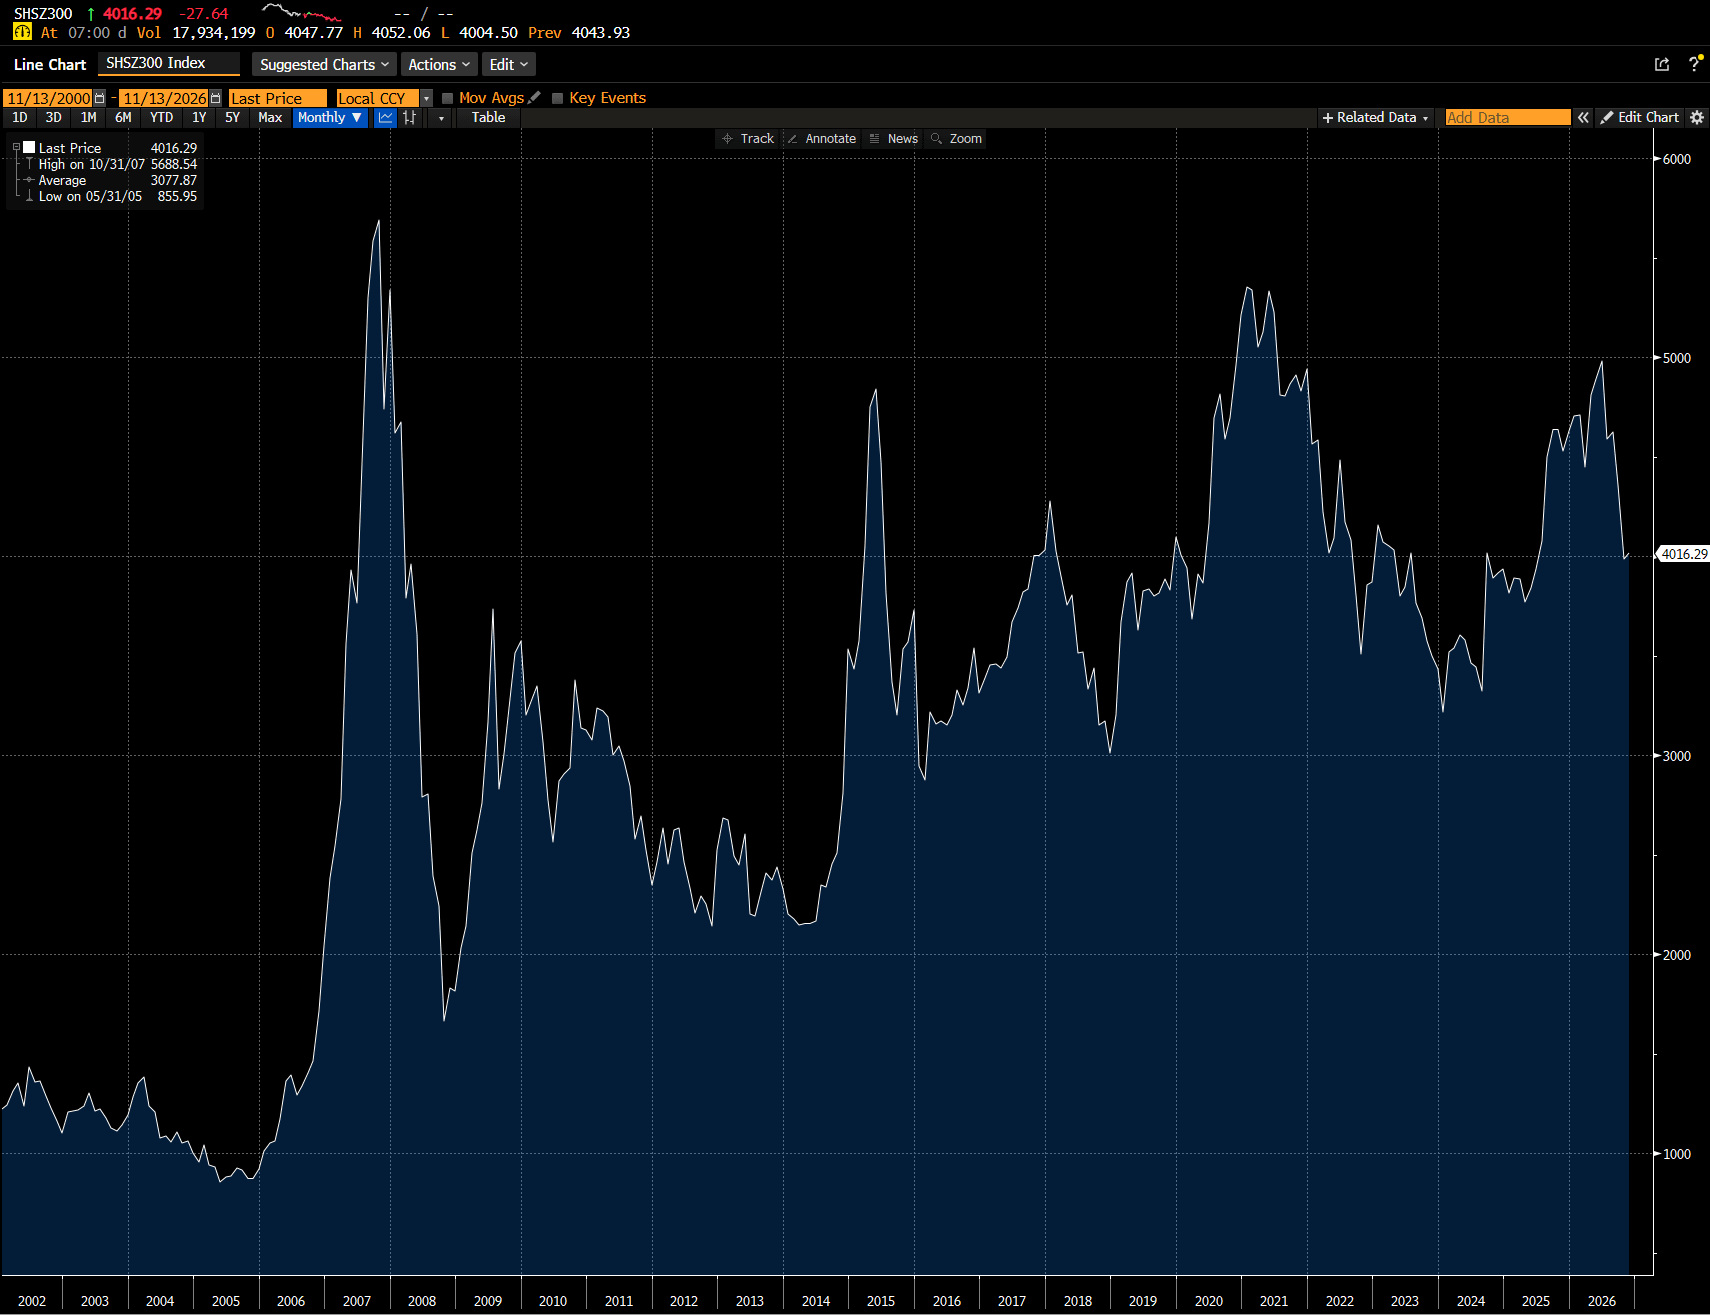
And China fiscal push also seems to match up with GLD/TLT reasonably well.
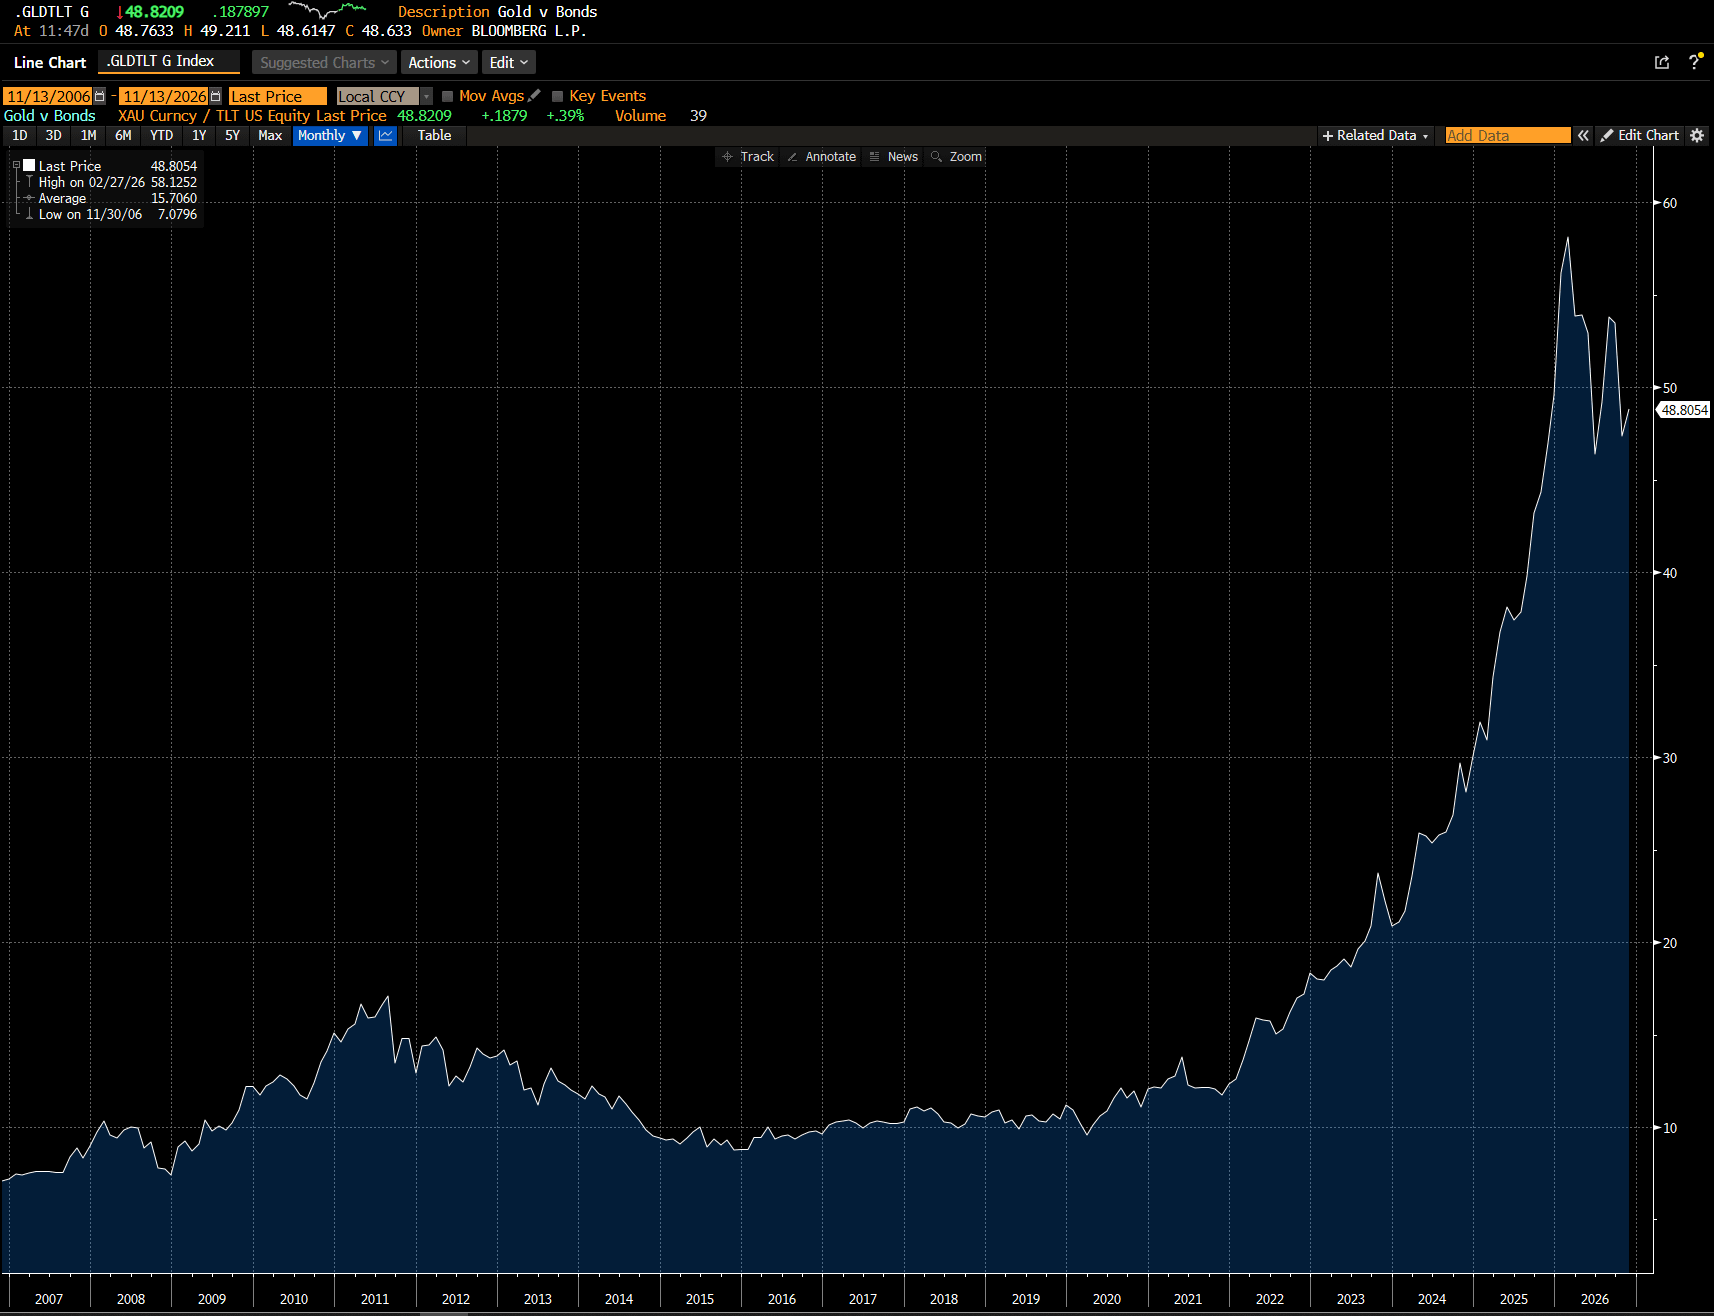
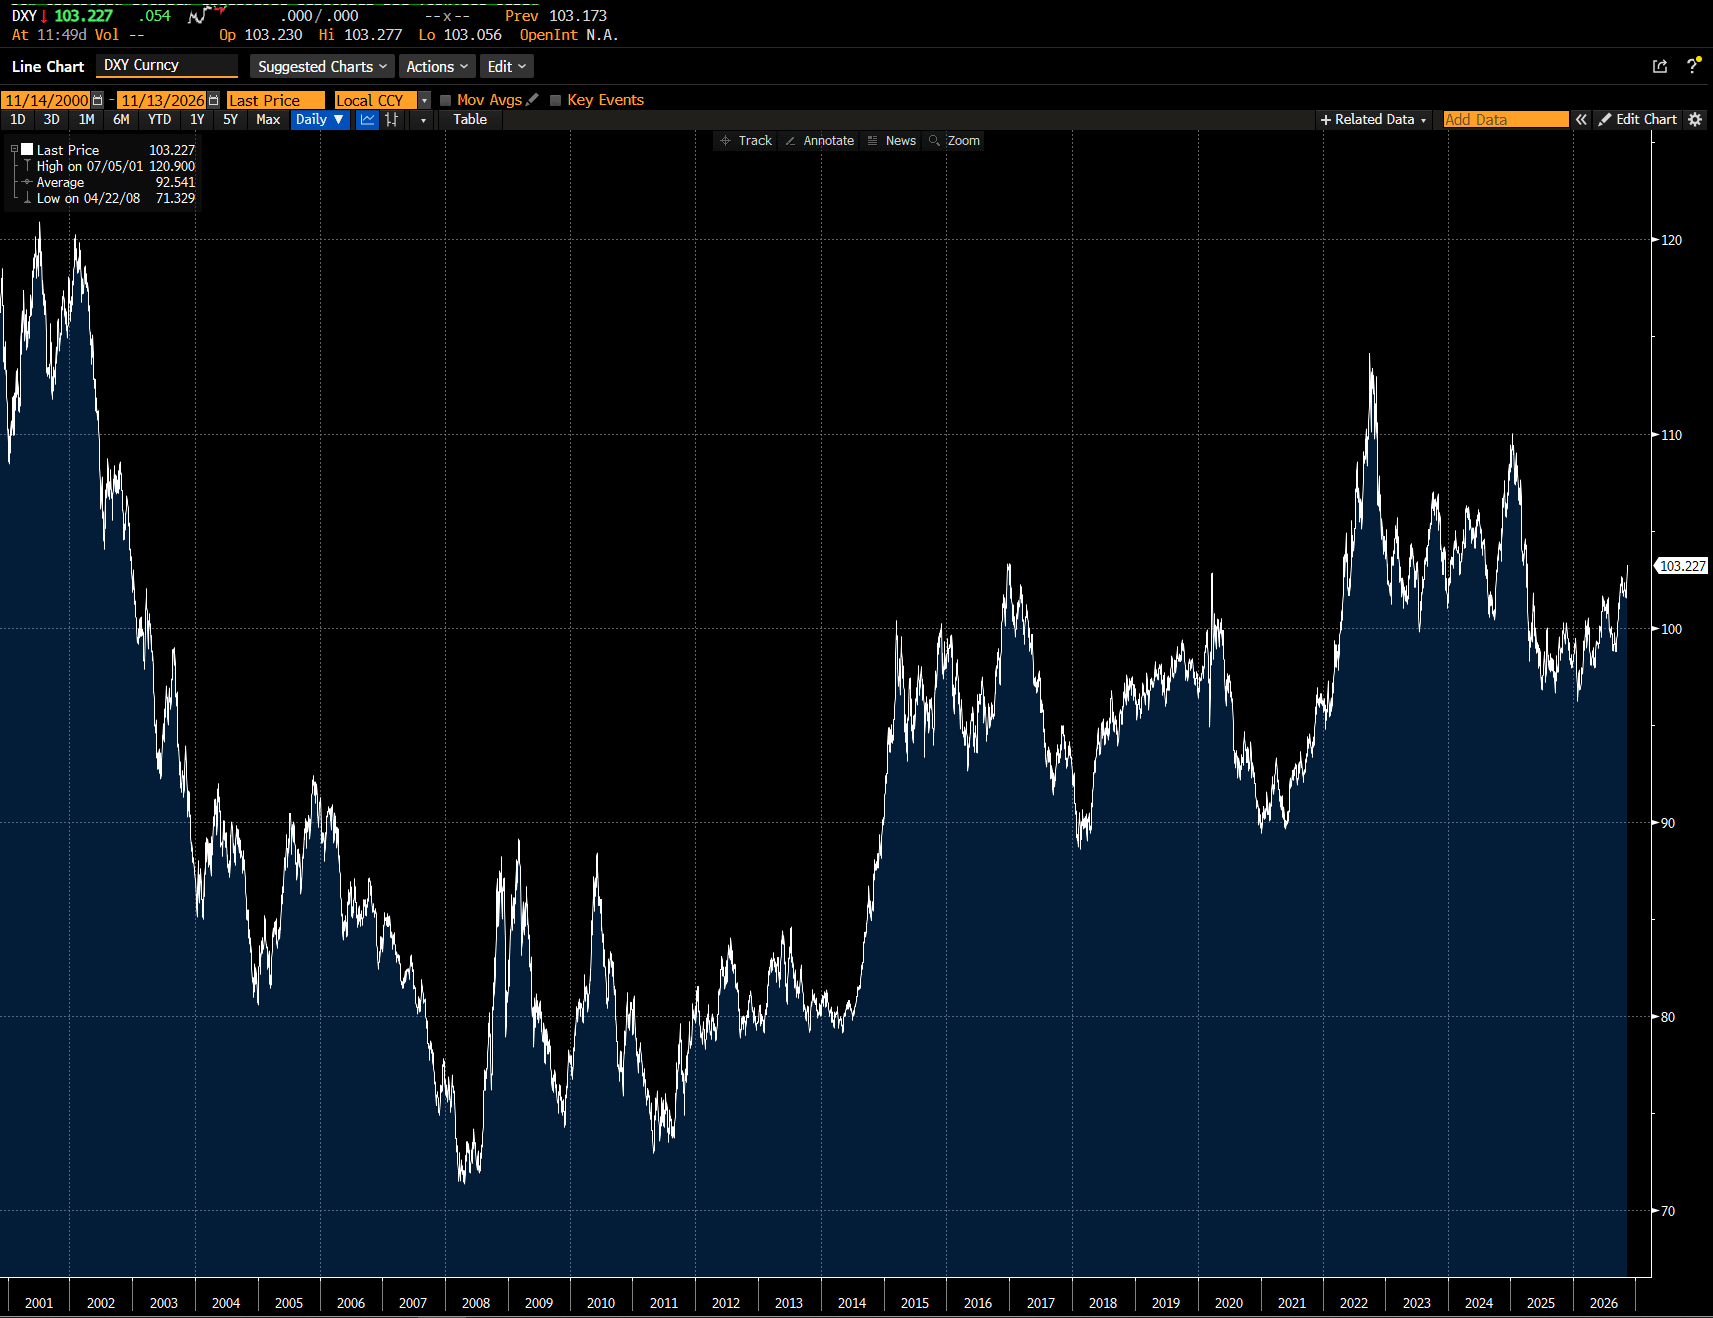
So gold would match better with a Chinese fiscal push, and given Chinese oil imports, higher oil prices would be more negative for China. Conversely, S&P 500 is a better match for US fiscal push, and counterintuitively, does better with higher oil prices, at least against China. It would also explain the surging US dollar.
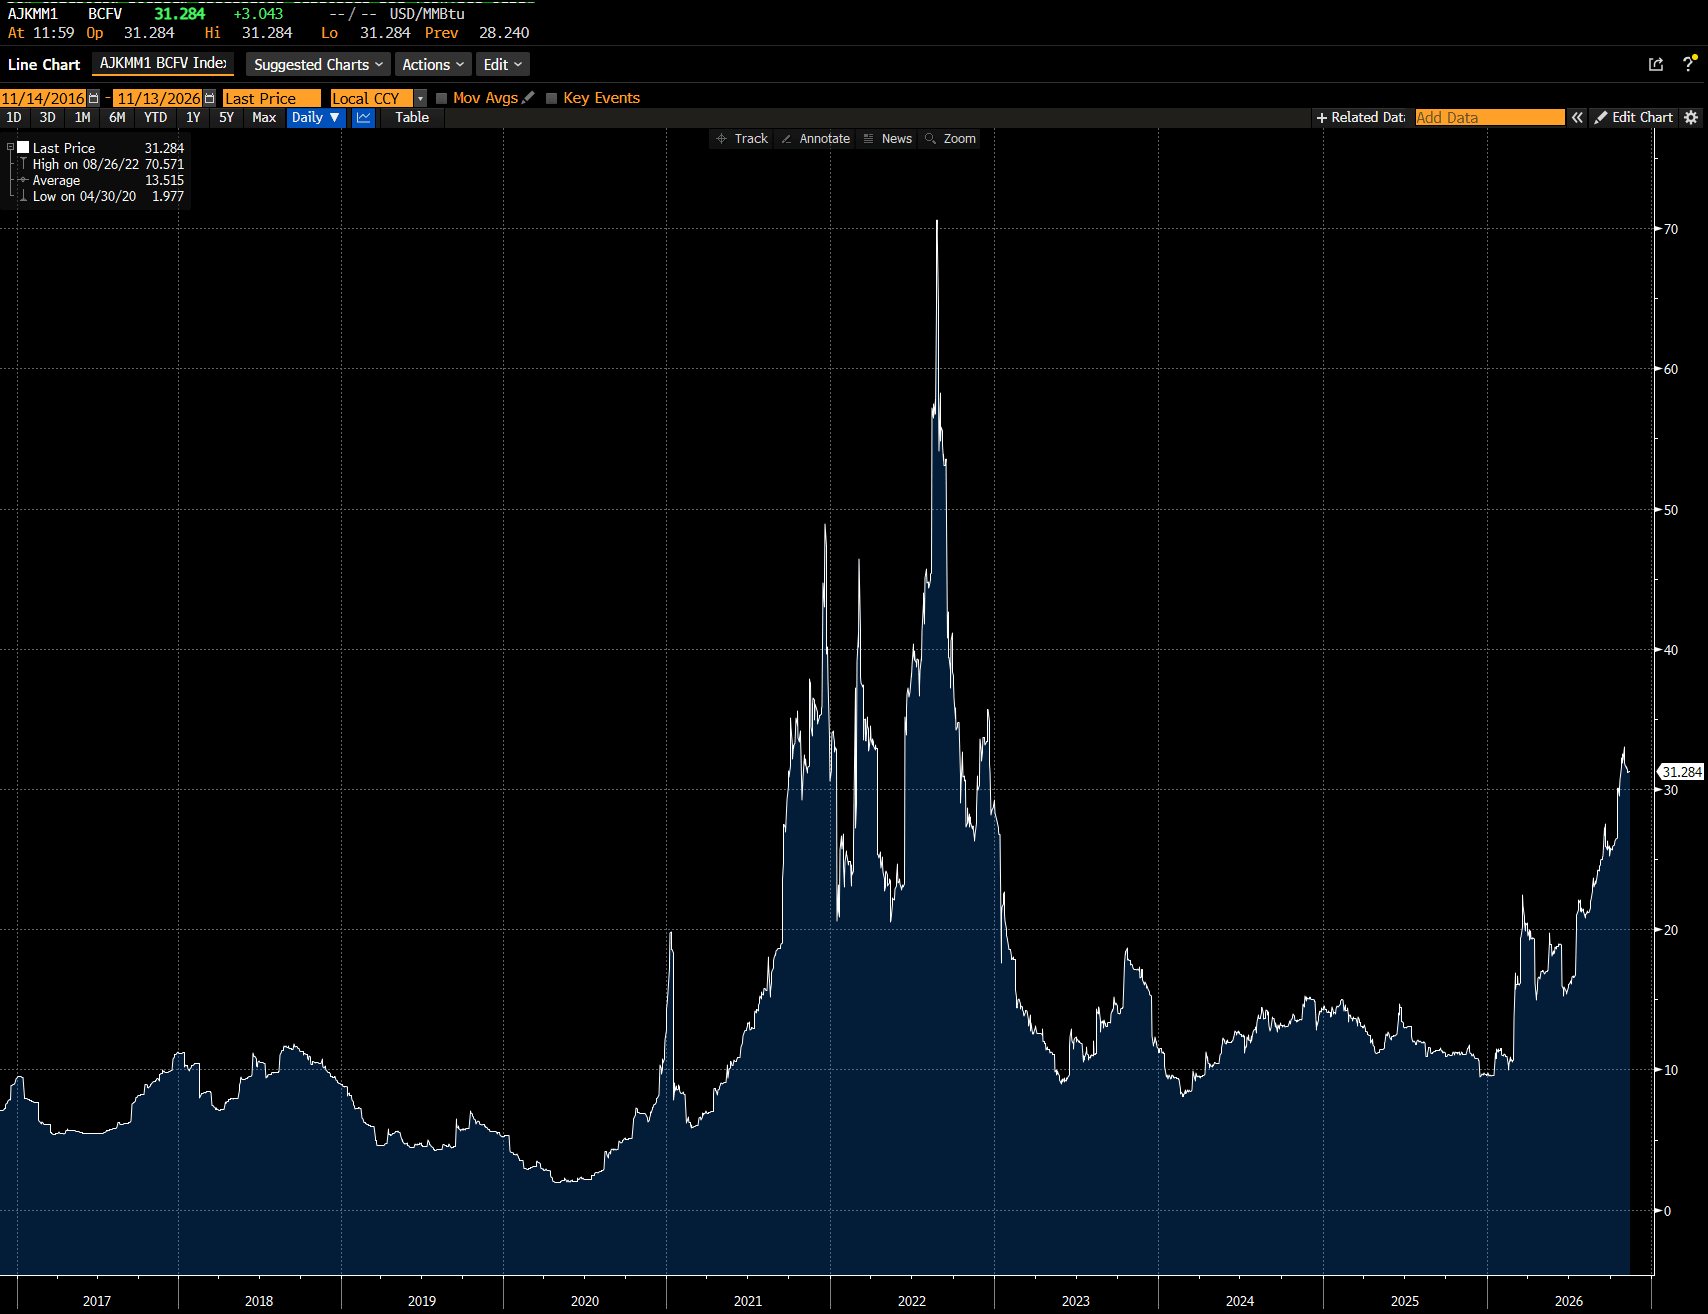
So this model would imply gold and oil ARE negatively correlated. So in 2022, gold dipped as well when energy prices rose.
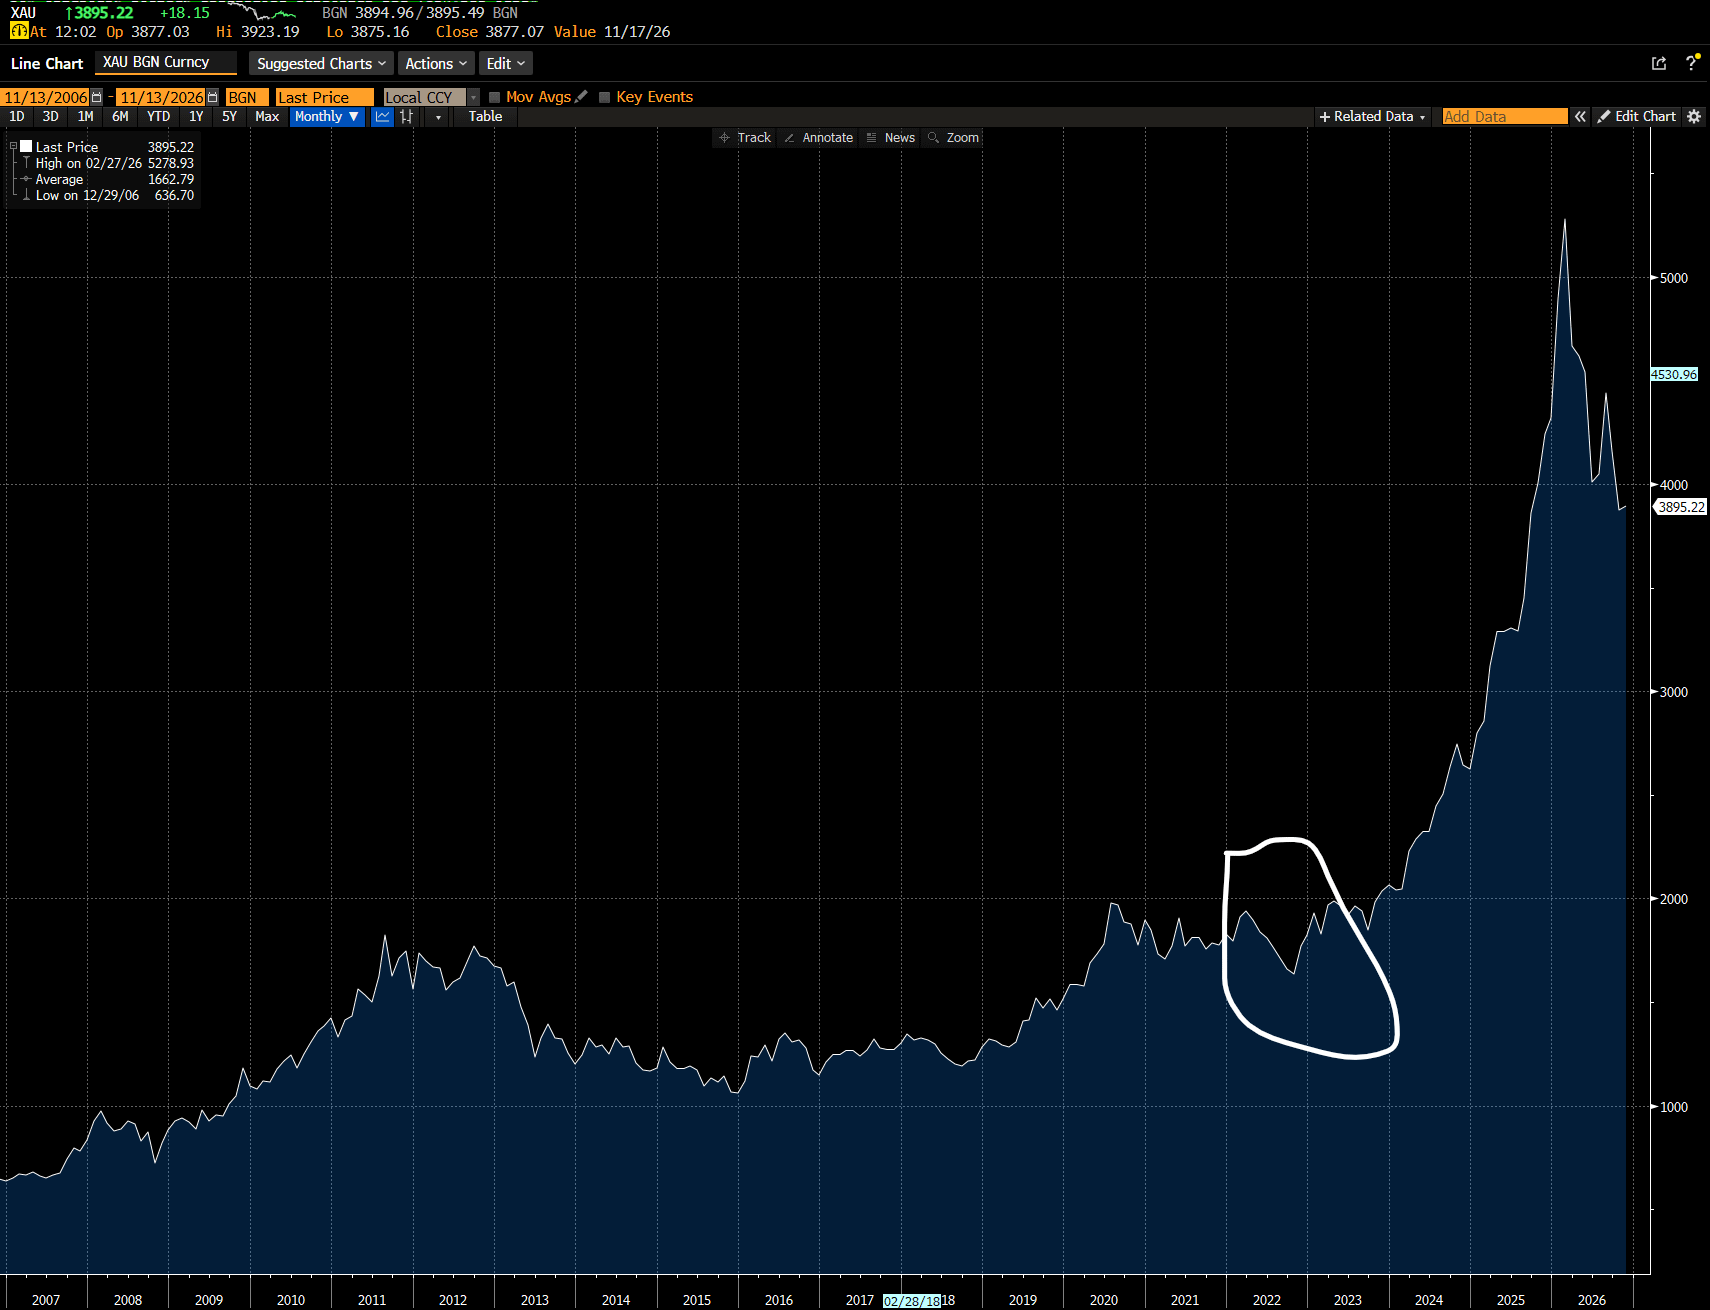
The question for gold is whether Asian LNG prices have topped out or not? With Donald Trump as president, almost an impossible question to answer.
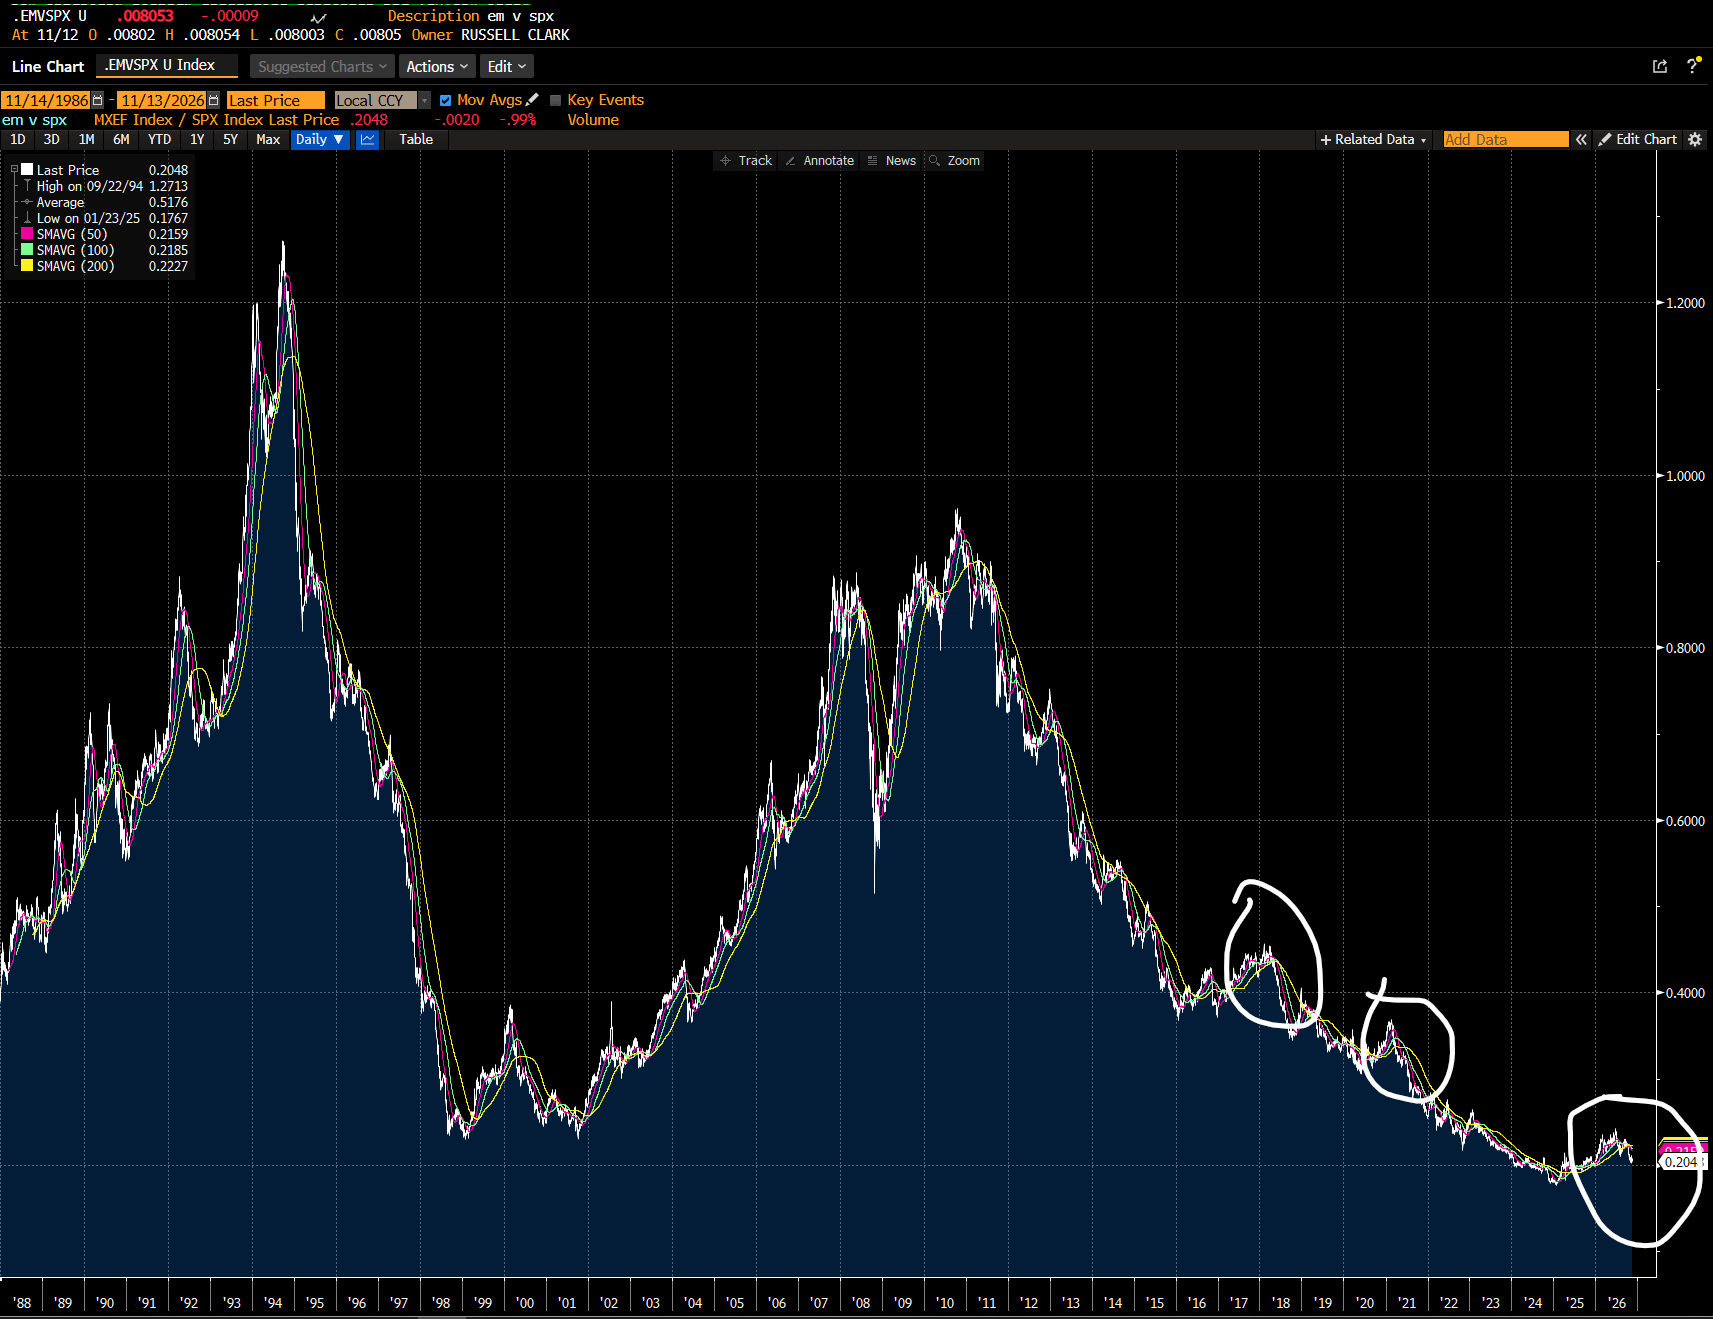
What does that all mean? Well SPX/TLT seems to be a US political decision (higher inflation vs higher share prices) , while GLD/TLT is a macro trade, that moves inversely to energy prices. I am not sure I like this analysis, as it break my rule of simplicity breeds elegance. But it does explain why every time someone thinks emerging markets has turned against the S&P 500, they get their face ripped off.
If there is a bear case for the US, it would be change in fiscal policy in the US. Perhaps a bigger emphasis on cash to workers, and a bigger tax on corporates. A buyback tax would also be problematic. That is a much more left wing approach to stimulus. But perhaps that is two years away, or maybe less?


