

NIIP is a relative new macro data point. While the US and Japan have data going back over decades, for many other nations we have relatively short period of data. The IMF now does quarterly updates for most countries, so we will use that to show the change in the behaviour of the NIIP. To simplify, I am going to look at countries with and absolute NIIP over USD 1 trillion and Europe - which give us a big 6. US is the only NIIP deficit nation, while Japan, Europe, China, HK and Norway are in surplus.

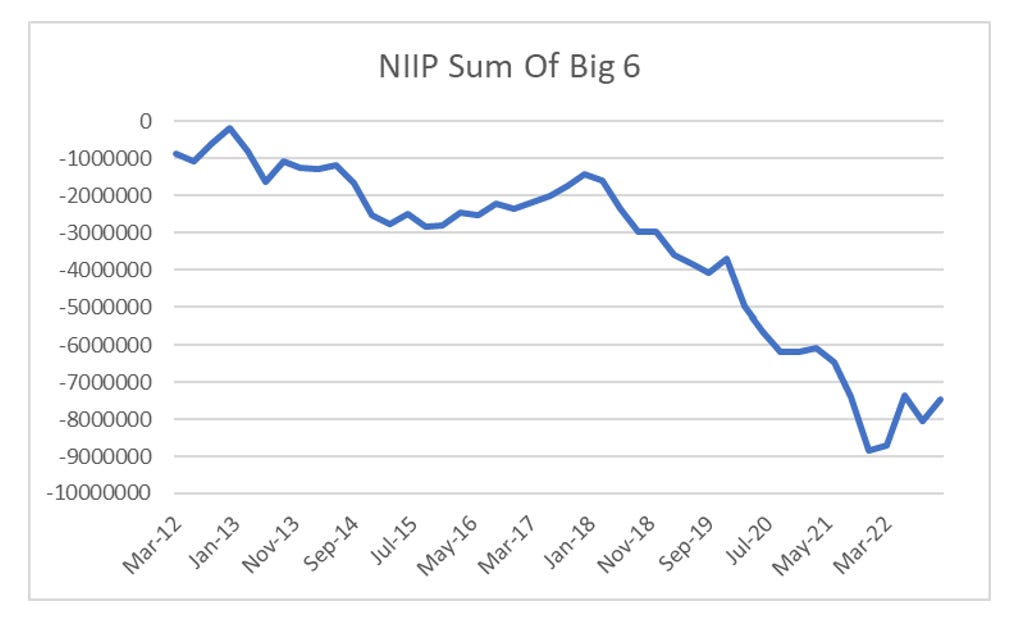
As suggested previously, I wonder if there are “offshore” corporate holdings, but when we look at Ireland NIIP - it is also negative. Saudi NIIP has flatlined over the last decade. The only country that probably should be included in the above it Taiwan, but the last NIIP data point is from 2016 at US 1 trillion surplus. So the data does have some problems. But it we take this big 6, and sum them, we can see in 2018, they were close to balanced. But by 2021, we had a USD9 trillion hole that had opened up.
The US provides the most complete and long dated numbers of NIIP.
