

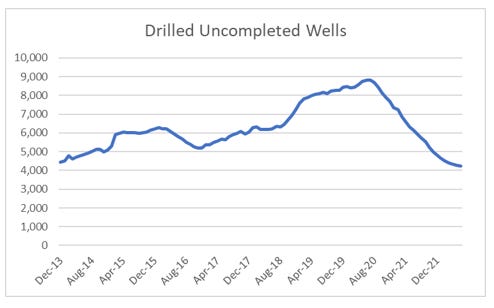
For the last 8 years or so, shorting oil on any sign of recession in either the US or China has been a good trade. Hence I can understand the temptation to see the inverted yield curve, or weakening activity in China and US as signs to get short oil. There are however some big problems with a bearish oil view here. From 2013 onwards US shale drillers were engaged in a manic rush to drill wells, leading not to only fast growth in US energy production, but a sizable inventory of Drilled, Uncompleted (DUC) wells. Today, that inventory of wells is still falling.
Shale drilling tends to produce more gas than oil, so the signs of oversupply first emerged in the natural gas market. As a rough rule, oil trades at 10 times the price of gas in the US (on an energy basis it should be 7, but natural gas is more difficult to transport). Hence the period from 2012 onwards offered a good opportunity to short oil as the natural has market was telling you it as at least 50% overvalued. That is not the case today, with natural gas pricing similar to the pre-shale days.

US inventory of oil is actually at the lowest levels since 2003. This is been driven by a collapse in the Strategic Petroleum Reserve (SPR) to the lowest level since 1984. Some people argue that with the US now a net oil exporter the SPR is no longer needed. This may well be the case, it is still not hard to see the depletion of the SPR as oil bullish.
