


This note will be focused on Australia, as it happens to provide all the data I need. While it is possible to argue that Australia might be special in some cases, none of the arguments presented below need not be confined to Australia. My belief that what is happening in Australia can be generalised to the Western World at least.
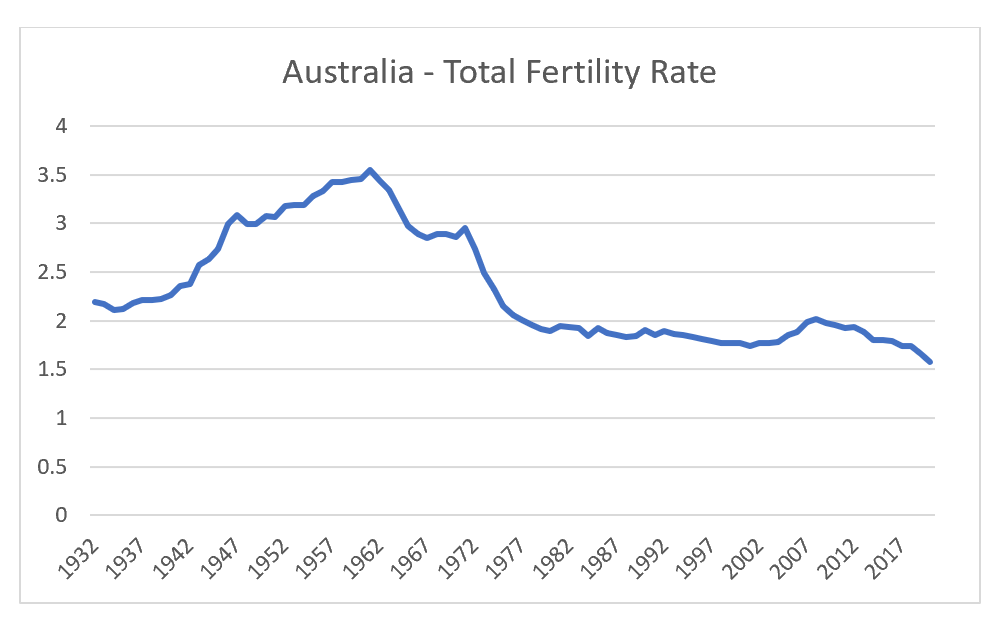
Almost all discussion of demographics begin and end with charts of total fertility rates. When the fertility rate is below 2, without migration, a population has to fall. Australia has recently dipped to its lowest ever fertility rate in 2020.
The fertility rate is a ratio of children to women of child bearing age. However, ratios tell you nothing about what the numerator and denominator are doing. It just tells you the relative movement. Using census data to 2016, we can break down the actual number of children and number of fertile women over time.

The impact of the baby boom is clear in the post world war period, as is the slowdown in the growth of children numbers from 1975 onwards, but recent trends show an acceleration in both the number of fertile women, and the number of children that are being born. Yes the population is aging, because people are living longer, but as long as the total number of young people are increasing, what is the problem? A demographic pessimist (of which there are many), will say that the fertility rate so low, we are below natural replacement levels, and hence doomed to have a shrinking population. I think this is too pessimistic.
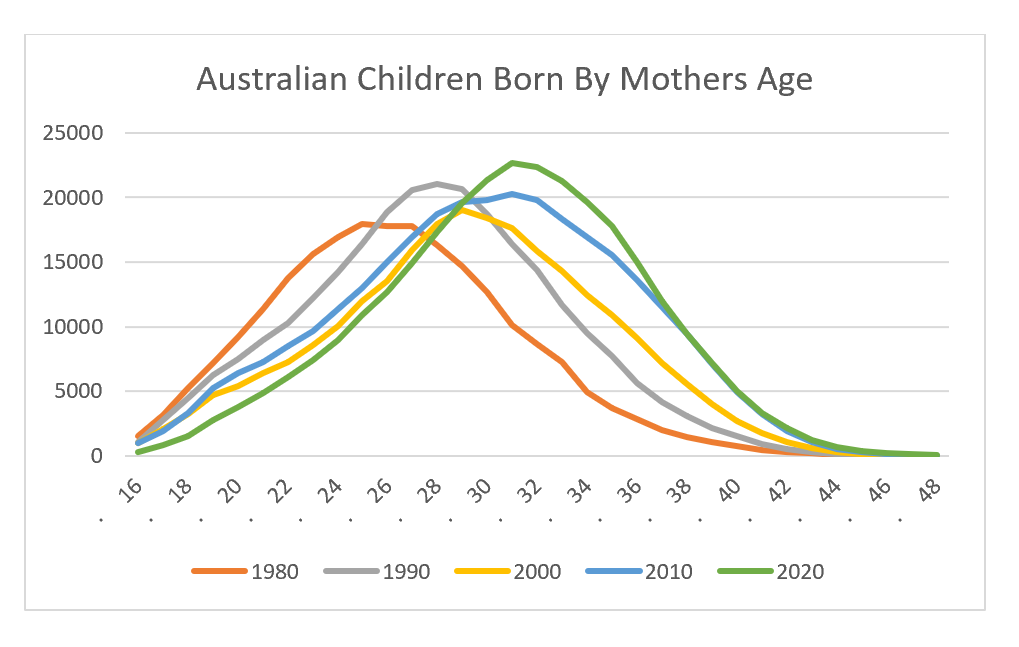
My view is that 1970s saw a change in government in Australia that encouraged female participation in the workforce, which cause a one time shift to women having babies later, which has now passed through the system. We can look at the distribution of children's births by mother’s age. There has been a clear shift to older mothers over time, but when we compare 2010 to 2020, we can see a both peak at around 32. That is 32 is acting as the age that most women have children. What is noticeable in 2020 that women are having more children in their 30s.
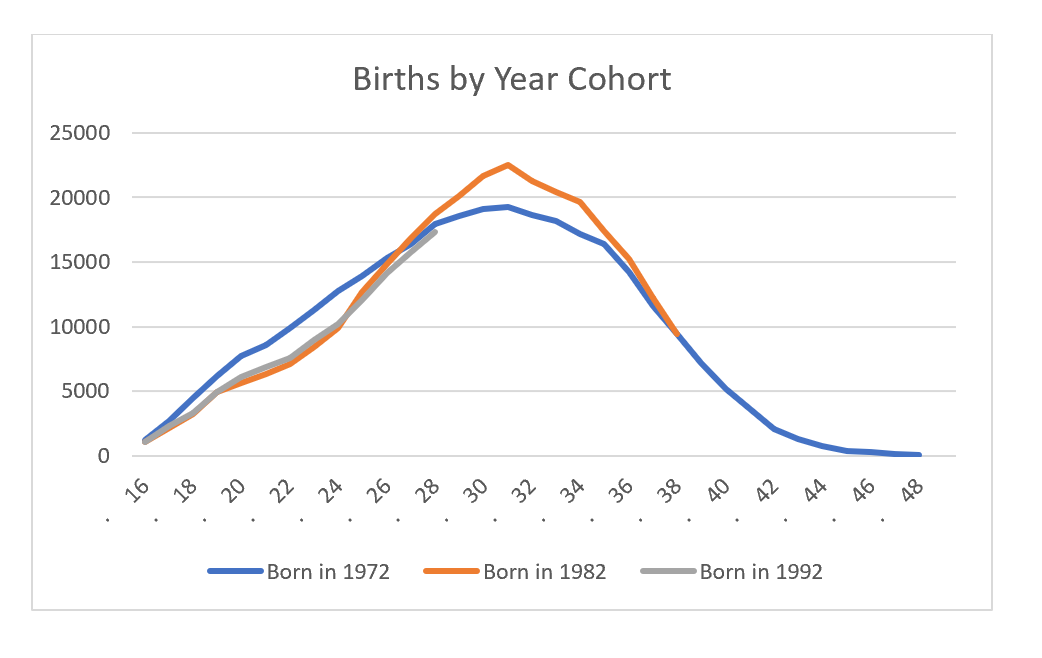
We can adjust the data to show how women born in the same year are choosing to give birth. While there is a noticeable different between birth patterns for women born in 1972 and 1982, there is hardly any difference between women born in 1982 and 1992 . Note women born in 1992, will only have data up to 28 years old, as this is 2020 data.
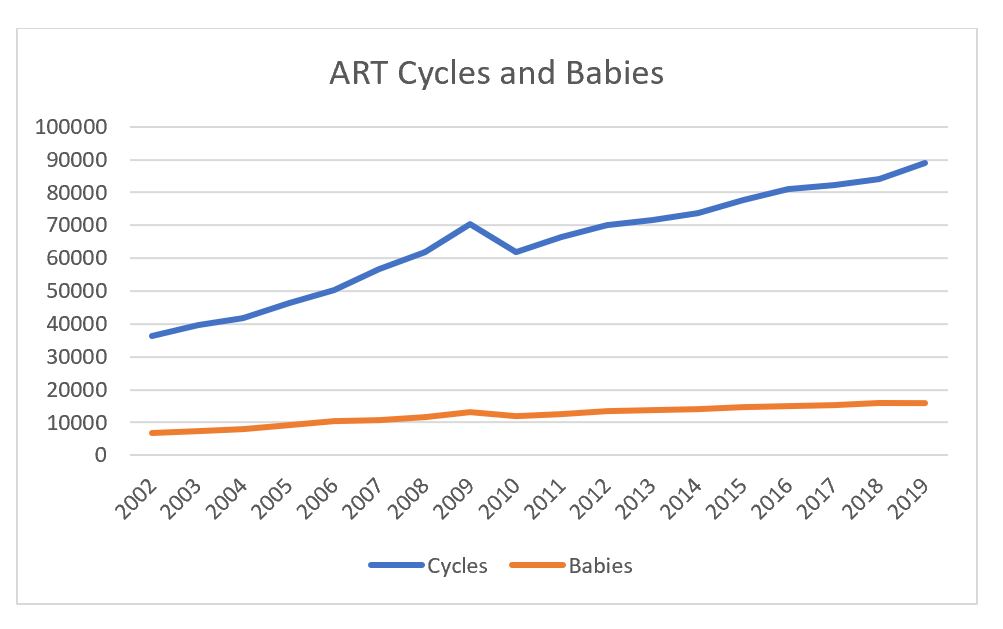
You could argue, that the evidence so far of changes in birth behaviour largely rests on me torturing data to produce some evidence, which is always a risk in all economic and demographic analysis. However Australia is one of the leading nations in the use of Assisted Reproductive Technology (ART). According to ANZARD, 4.3% of births in Australia and New Zealand in 2019 used some form of ART. Trawling through the ANZARD reports back to 2002, reveals some interesting data. The average age of a mother using ART has remained at 35.8, with 90% of patients over the age of 30. The incidence of multiple births (twins etc) has fallen from near 20% in 2002, to less than 3% (which would have been a headwind for birth rates).
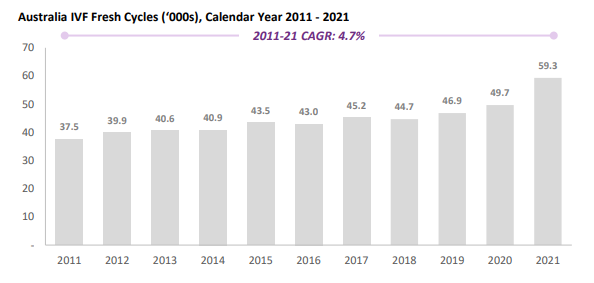
Unfortunately this data stops around Covid, and so we could wonder what birth trends have done since then? The good news is that Australia has a listed ART sector. Virtus Health is a leading provider of ART. In their most recent presentation they reported very strong market growth in cycles, and 20% above pre-Covid levels. I also wonder if demand for ART procedures are rising rapidly, are we also likely to see a steep increase in natural births as well?
The market thinking is that families are having less children, and having them later. But what if they are having the same number of children, but just doing it later? The shift from younger to older mothers, will slow the number of births, but then lead to acceleration in births as mother’s move into the new key birth age of 30 to 40. Existing birth data shows that shift to older mothers is slowing. And IVF (ART) data is showing that older mother births are increasing. In Australia at least, the skew of births is likely to continue to increase to the right, pushing up total fertility rates as it becomes easier to have children as an older mother.
This analysis solely looks at the trend of mothers getting older, and arguing that this is no longer a negative for total fertility rates. This alone makes me think that demographic trends are much better than currently understood. However, I think political changes are likely to begin allow younger women to also have children too. That is for part 2 of this analysis. Taken together, I think we are on the cusp of a baby boom.

HERE COMES THE BABY BOOM - PART 1