

After various discussions with subscribers, I have realised the premium and discount that GBTC has traded at over time has made a thrown out my flow model. Most exchange traded funds give you a shares outstanding number that you can just download. Managed funds do not do that, so I had built a simple model that downloaded price and assets under management to then back out share count. Managed funds can trade at premium and discounts to NAV, but rarely for too long, so my share count model worked fine. GBTC is a very different kettle of fish. Its premium has been as large as 140%, and discount is currently at 31%.

So I need to adjust the way I look at GBTC. This simplest way to do that is to take total fund assets and then divided by the Bitcoin price, which should give us number of bitcoin owned by GBTC. If that is rising, then money is flowing in, if its falling, money is flowing out. Having revised this calculation, its shows that flows at GBTC have been flat since 2021.

The other issue that people raised was the the long positioning that I was seeing in CME data was driven by funds hedging their positions in GBTC.
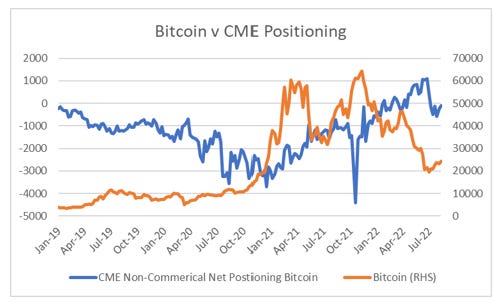
I don’ t think this is the case. Net positioning in CME should have been long when hedge funds where short GBTC, and positioning shows the opposite. We can also disaggregate the net position in CME futures to long and short, and if GBTC flows were driving net positioning, we should have seen large long positions fall as short positions in GBTC were closed. There may have been some influence on CME positions from GBTC in 2020 and early 2021, but shorts have now been rebuilt, without any change in short interest in GBTC, suggesting CME data is now free of GBTC influence.

One of the reasons I was using GBTC was that I could easily download the data from Bloomberg, and it was matching up with data that I could get from www.coinmarketcap.com - but which took far more time to format. Given the problem I have had with GBTC I have gone back to look at the data from www.coinmarketcap.com. One of my theories was that bitcoin was a liquidity driven asset that was driven by inflows. One way I thought I could look at inflow was the market capitalisation of stable coins. Originally, I only need to look at Tether, but now USDC, USD Binance and Dai are all big stablecoins too.

Before 2021, Tether was the only big stablecoin, so when I look at bitcoin to stablecoin market capitalisation, I am only using tether numbers before 2020. The heavy fall in bitcoin this year has coincided with the first meaningful outflows from stablecoins.

So having corrected my erroneous data, and fixed alternative data sources, do I still think crypto is no the slope of hope? The new data is far more inconclusive. It is neither particularly bullish of particularly bearish. We have seen some stablecoin liquidation, which is now stabilising, and CME data is no long excessively bullish. Like most speculative assets, it is probably waiting for the Fed to pivot doveishly. You may be waiting awhile.
