Let’s take a closer look at the logic I am using to get my bearish bond view. First of all, I think inflation is going to be consistently higher than expected. But not just any inflation - food inflation. This is already happening. This is on a log scale so that you can see the recent move in food inflation is substantial, and to my mind a trend breaking higher.
On a very simplistic basis, I look at us CPI and think both Fed Fund Rate and bond yields have to go higher. The chart below shows CPI compared to Fed Fund rate. This chart also shows you why Ben Bernanke get very little love, as he began a still ongoing cycle of keeping Fed Fund rates being set at below inflation in 2002.
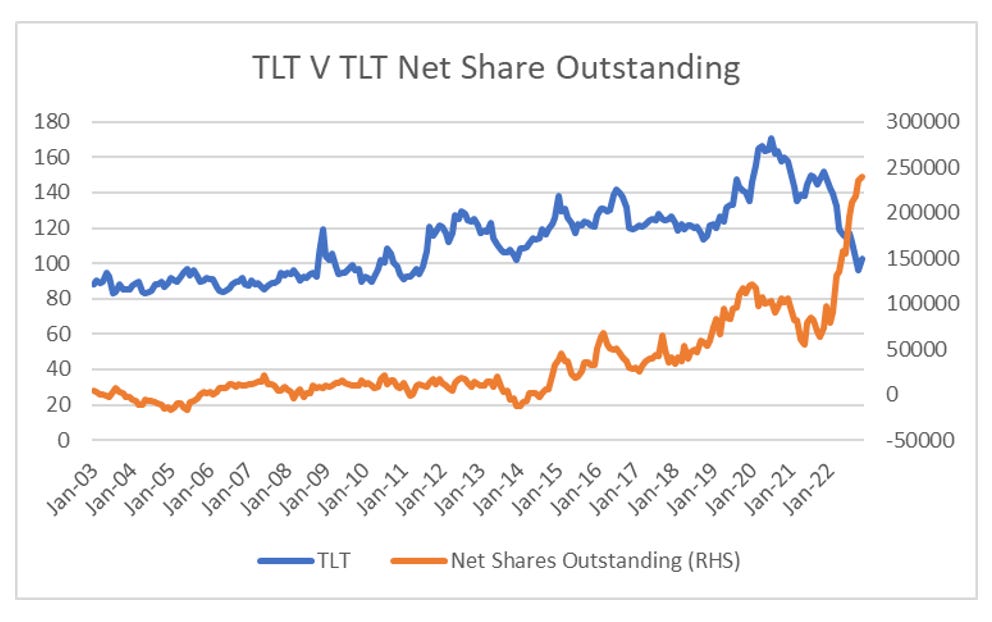
So for me, if I see signs of food inflation going in reverse, then I will reverse my bearish view on bonds. At the moment, I see no sign of food inflation reversing. However, when I look at TLT US - an ETF that buys long dated bonds, I see record net inflows (shares outstanding - short interest).
For a lot investors, yield curve inversion is seen a sure sign of a coming recession, and time to buy bonds. Certainly since 1982 a yield curve inversion has marked out the top in a Federal Reserve hiking cycle.
By being bearish bonds am I saying that thing no fund manager should ever say - “this time is different”. Actually I don’t think I am. The first question is to ask where does yield curve inversion come from? There are lots of different ways to think about the bond market, that is economic cycle predictor, to a vigilante correcting wayward policies. There could be something to that, but at its most simple, bond yields also have to add up to what the market things interest rates are going to be over that life of the bond. If you think the Federal Reserve is going to keep the Fed Funds rate at 4% for the next 5 years, then you will be buying 5 year bonds at yields over 4%, and selling at yields under 4%. If you think about bonds in this way, you can value 5 year treasury yields versus the average of the fed funds rate for the last 5 years. It would look something like below.
We can do a similar chart, but extend this out to 10 years. This chart does scare me. Looking back to the 1960 and 1970s, even in a bond bear market, the 10 year did seem to mean revert back to the average. The current 10 year average of the Fed Fund Rates is only 0.8%, and rising slowly. The implication is that 10 year bond yield could fall all the way back to 1%, even if I am correct that inflation continues and the Fed Fund Rate does not fall.
But I think that is the wrong way to analyse it. A better way to look at it is to compare current Fed Fund Rate to average of the Fed Fund Rate over the last ten years. There is a clear benefit to that way of thinking. The 60s and 70s, were pro-labour eras for me, which shows that Fed Fund Rate can diverge widely from its previous 10 year average. It also shows the clear break in 1980s, where in a pro-capital environment tightening policy relative to the last 10 years would create a recession. As I believe we inflecting to pro-labour environment, I don’t fear the inversion.
Its back to wage led growth in the West, and monetary policy needs to be tight to protect real wages. Yield curve inversion is likely to be the norm for the foreseeable future - and bonds still look like a short to me.


